Home
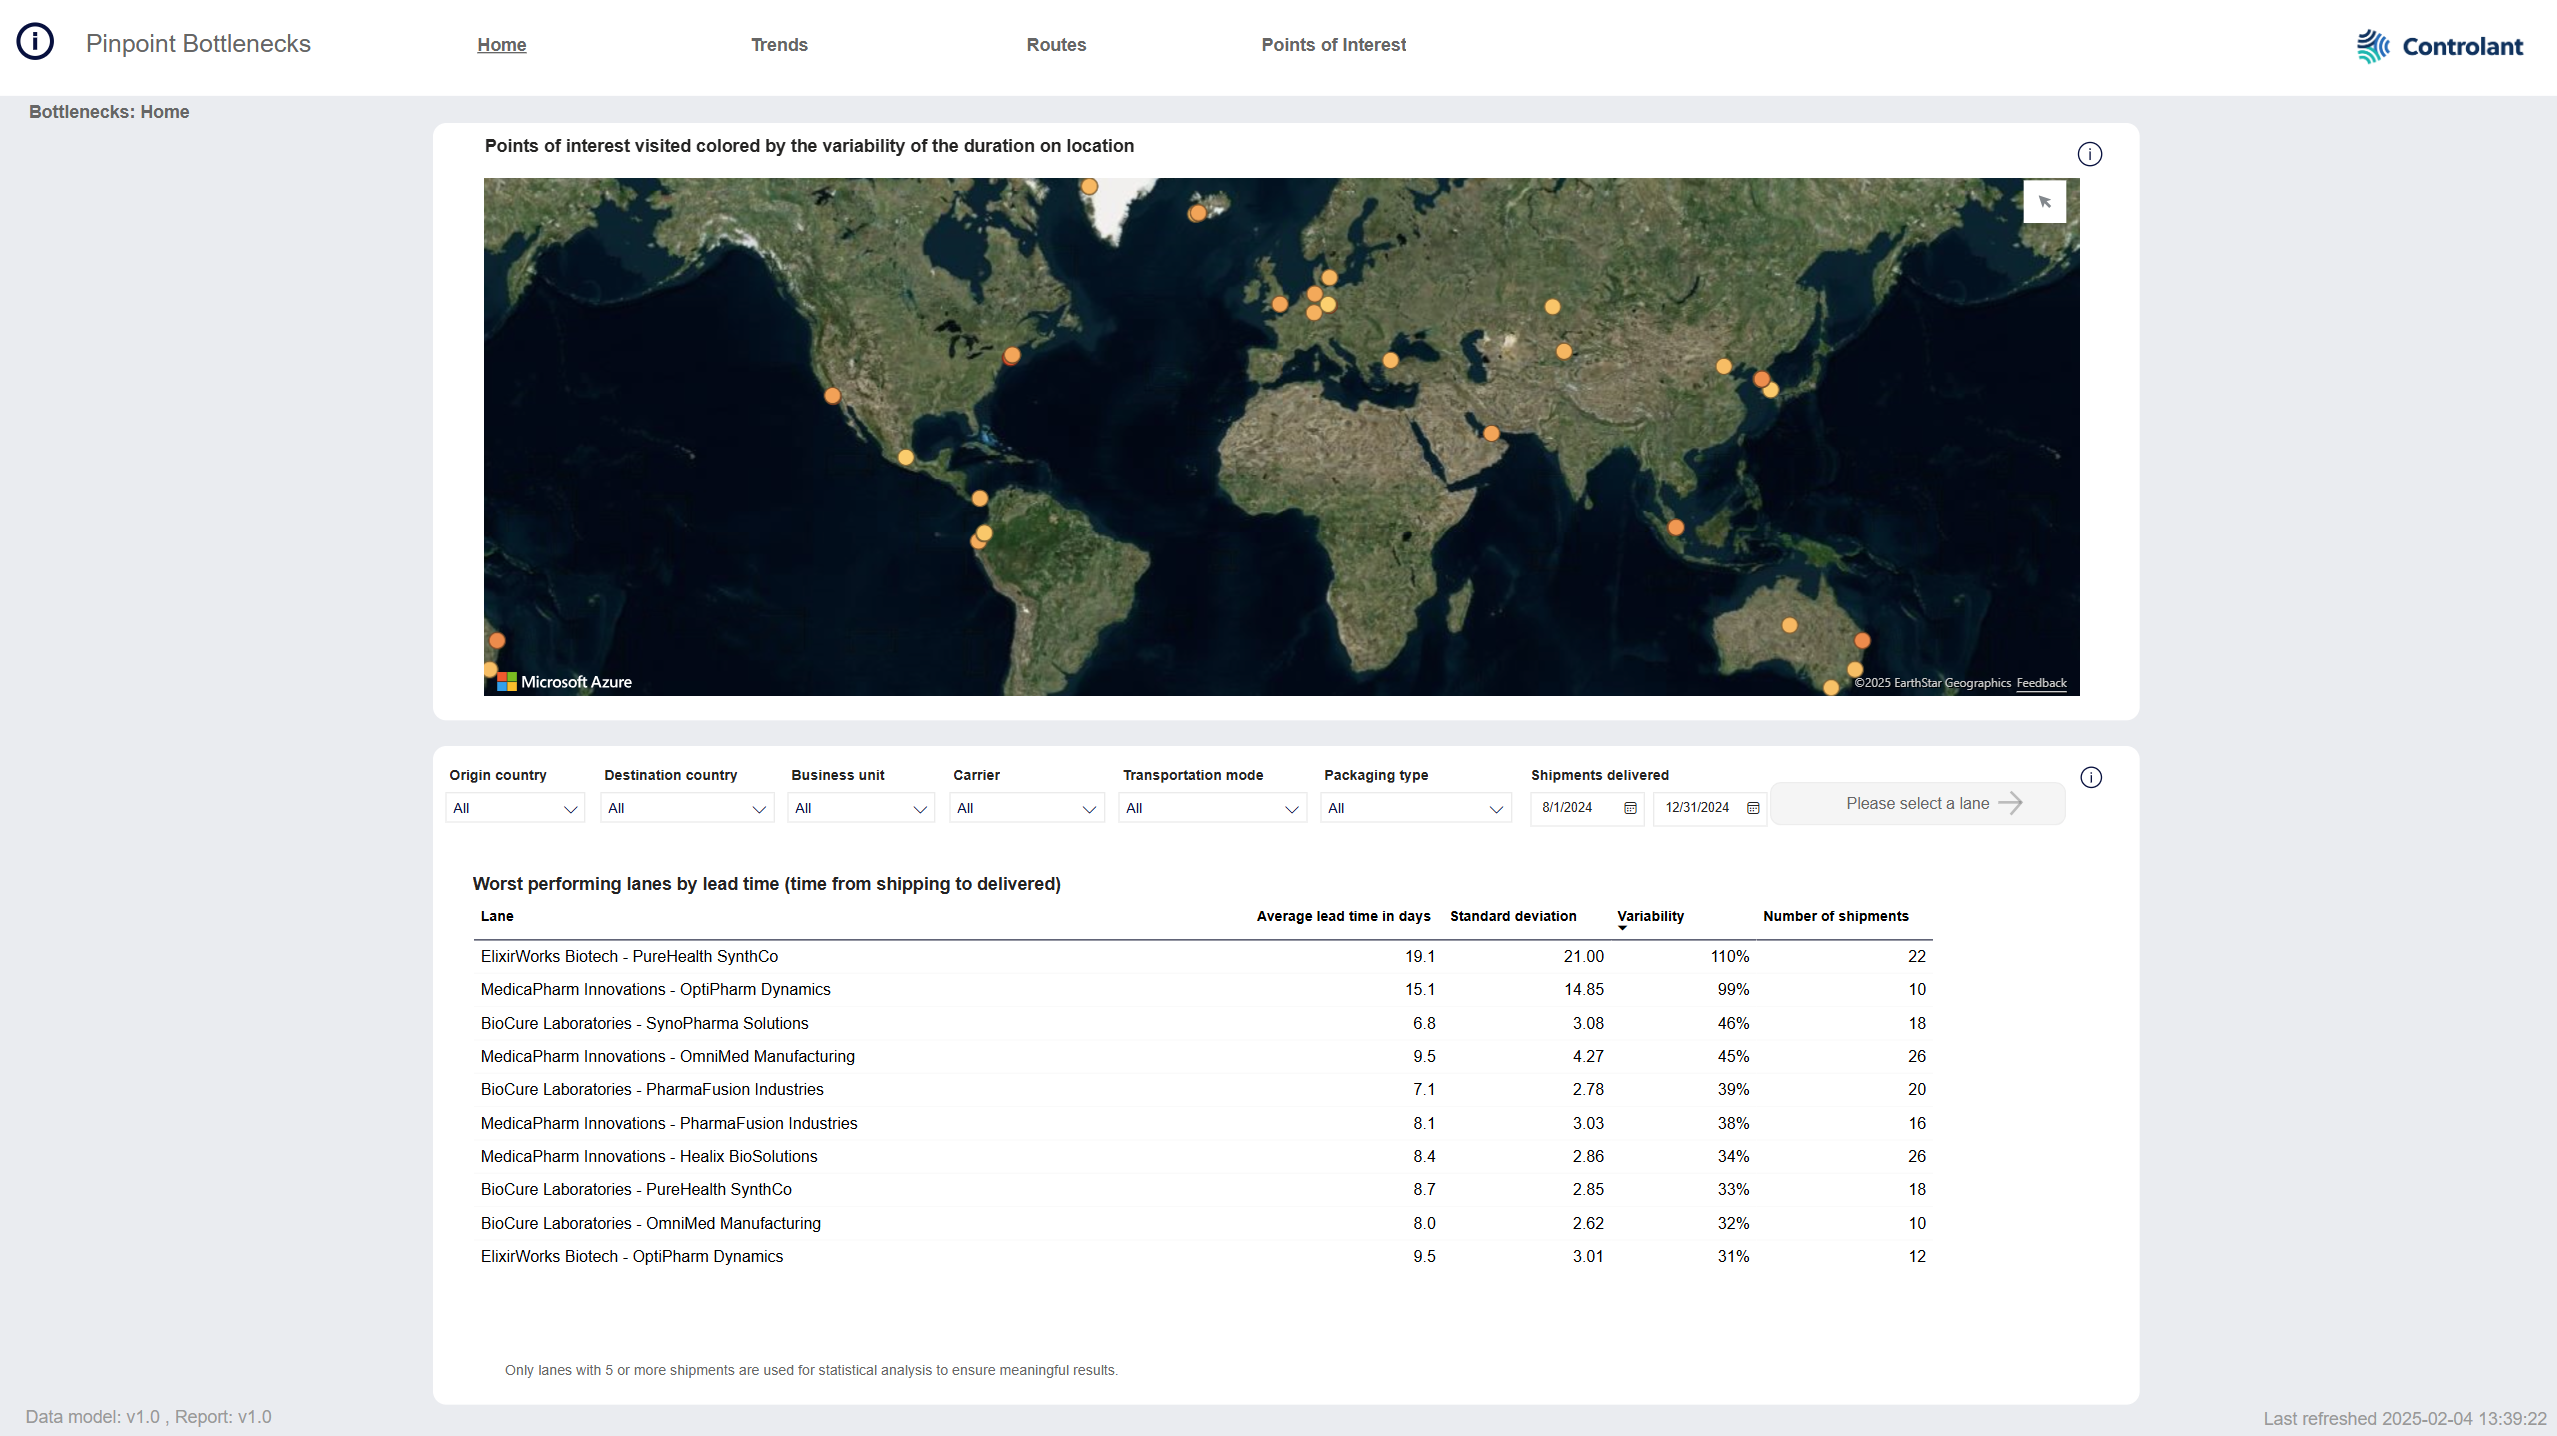
The Home page shows bottleneck lanes; the top 10 high volume lanes that have the longest lead times.
These 10 lanes have been identified via statistical analysis based on shipment volume and variability to be the most impactful lanes.
Interactive map showing points of interest (POIs) with excursions for the 10 worst performing lanes.
Color of dots indicates duration of visits: Yellow indicates a shorter duration, orange indicates a longer.
Details about the worst performing lanes by lead time variability.
Note
A point of interest (POI) is a a customer defined location, airport or harbor that shipments have traveled to and/or from.
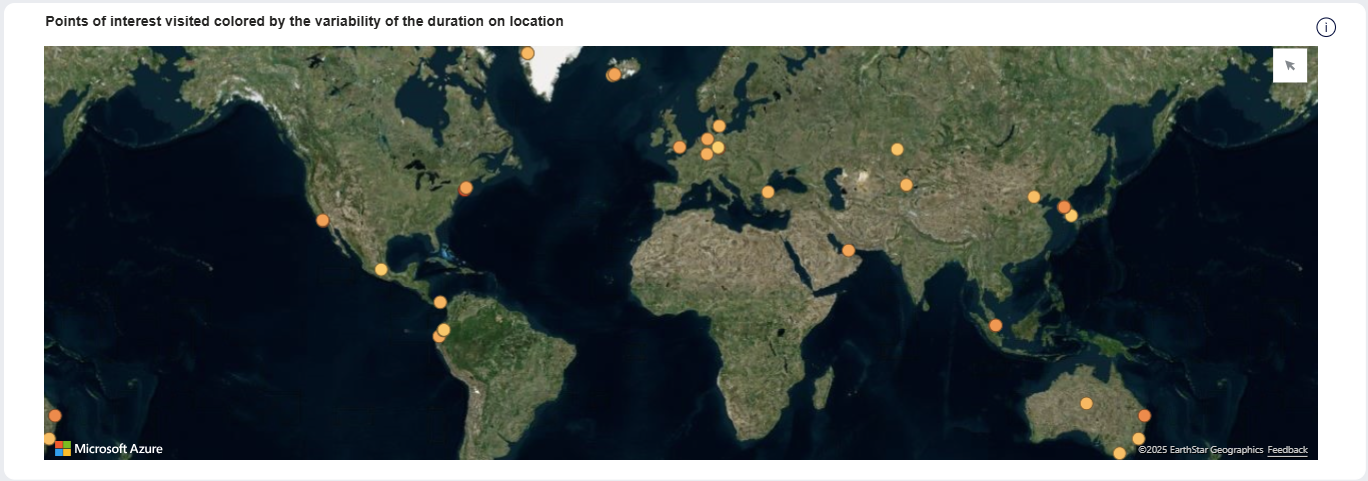
Interactive map showing location of POIs in the 10 worst performing lanes, color indicating variability of the duration at location.
Tip
You can click a lane in the table below to show the location of POIs on that lane only.
Tip
You can hover over a POI to see the following information:
geocoordinates of location
name of location (POI)
average duration of stay
variability % in duration of stay
variability % in duration of stay for all lanes
Tip
You can select areas on the map using the selection mode:
 - point to and the selection mode options appear:
 - select a circular area
 - select a rectangular area
 - select a polygonal area
 - perform a range selection, to select an area within a specific distance or travel time from the selected point
The data in the page will update to show only POIs within the selected area.
You can zoom in and out on the map:
To zoom in on the map, do one of the following:
Double-click the map.
Scroll up with the scroll button on your mouse.
To zoom out on the map, scroll down with the scroll button on your mouse.
You can resize the map:
To see a larger map, click
 (focus mode).
A larger map appears.
To return to the dashboard, click Back to report.
The previous page appears.
Details about the worst performing lanes by lead time variability.
Drill through selected lane

For more information about a lane, select the lane in the table below and click Learn more. The Routes page opens with the lane selected.

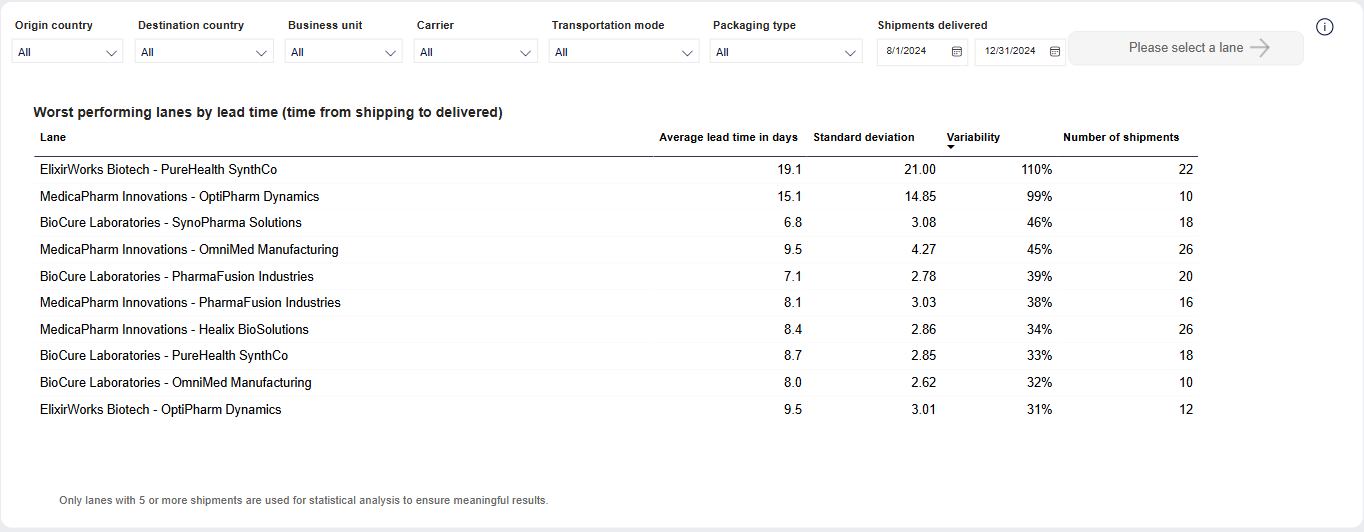
You can filter the data in the table. The filters will affect the contents of the table as well as the map above.
Note
Not all customers have the same filters. You may not see all of the following filters, or you may have filters not shown here.
Tip
To filter the list of options, start typing in the search field.
Tip
To clear the filter, click the eraser  .
.
Item | Description |
|---|---|
Origin country | Origin country of lane. Click to select, or press CTRL and click to select more than one from the list. |
Destination country | Destination country of lane. Click to select, or press CTRL and click to select more than one from the list. |
Business unit | Business unit of shipment, as configured in custom properties in Supply Chain Monitoring. |
Carrier | Name of carrier, as configured in custom properties in Supply Chain Monitoring. |
Transportation mode | Mode of transportation of shipment, as configured in custom properties in Supply Chain Monitoring. Click to select, or press CTRL and click to select more than one from the list. |
Packaging type | Type of packaging, as configured in custom properties in Supply Chain Monitoring. Click to select, or press CTRL and click to select more than one from the list. |
Shipments delivered | Date range shipment was delivered. Type a date, or click
|
| Click to view details about the selected lane in the Routes page. |

Worst performing lanes details table
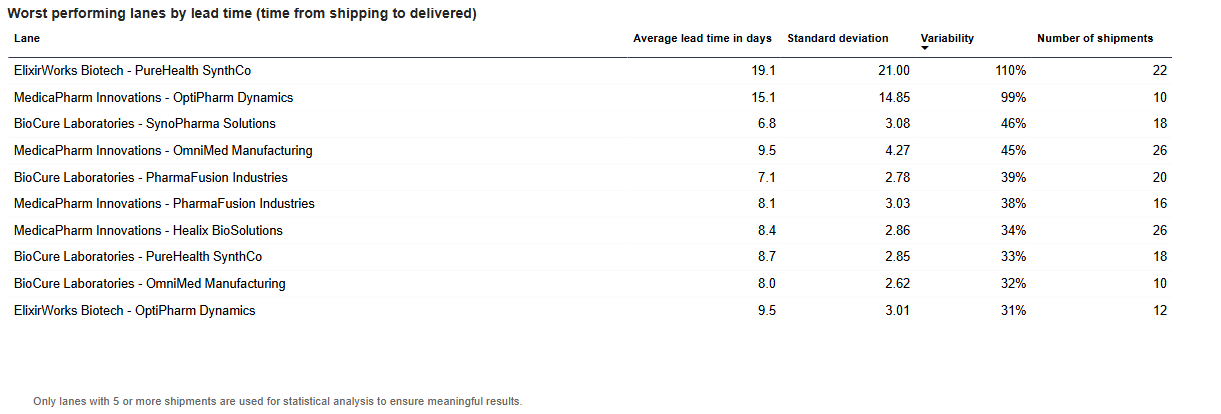
List of top 10 worst performing lanes that have a minimum of 20 shipments.
Tip
For more information about a lane, select the lane in the table below and click Learn more. The Routes page opens with the lane selected.
You can do the following with data in tables:
Export data:
Export the data with the current layout
Export summarized data:
as a comma separated values file, .csv
as an Excel file, .xlsx
Show as a table
Spotlight
Get insights
Sort descending
Sort ascending
Sort by column
Tip
You can click any column header to sort the contents of the table by the contents of that column. An arrow indicates the column the table is sorted by: An arrow pointing up indicates ascending order, and an arrow pointing down indicates descending order. Click the column header to toggle between the two.
Item | Description |
|---|---|
Lane | Lane name: origin location - destination location. |
Average lead time in days | Average lead time in number of days: average time between the shipped date and the delivered date across all shipments on this lane. NoteLead time is the time from when a shipment starts shipping until it is delivered in the Controlant Platform (SCM). |
Standard deviation | Standard deviation of lead times; indicating how much individual lead times deviate from the average. A higher standard deviation indicates greater variability in lead times. |
Variability | |
Number of shipments | Number of shipments between the origin and destination that were delivered in the filtered period and have a shipping duration of less than 150 days. |