Pinpoint Bottlenecks
Release notes for Controlant Analytics - Pinpoint Bottlenecks.
Solution | Controlant Analytics - Pinpoint Bottlenecks |
Version | 1.1.0 |
Type of release | Minor |
Live release date | 1 September 2025 |
Improvements and bug fixes
Updated to use new tables from Pinpoint data model v2.2.0.
This results in the new location group names being displayed in the report.
Fixed filter on home page to use the correct location type.
Customer impact: Low
Solution | Controlant Analytics - Pinpoint Bottlenecks |
Version | 1.0.2 |
Type of release | Patch |
Live release date | 16 May 2025 |
Improvements and bug fixes
All filters/ slicers in the report now have a search function.
Customer impact: Low
For the user guide for Pinpoint Bottlenecks, see Pinpoint Bottlenecks.
Solution | Controlant Analytics - Pinpoint Bottlenecks |
Version | 1.0.1 |
Type of release | Patch |
Live release date | 14 March 2025 |
Improvements and bug fixes
Added user guide to Pinpoint Bottlenecks.
Minor bug fixes.
Customer impact: Low
Solution | Controlant Analytics - Pinpoint Bottlenecks |
Version | 1.0 |
Type of release | Major |
Live release date | 1 February 2025 |
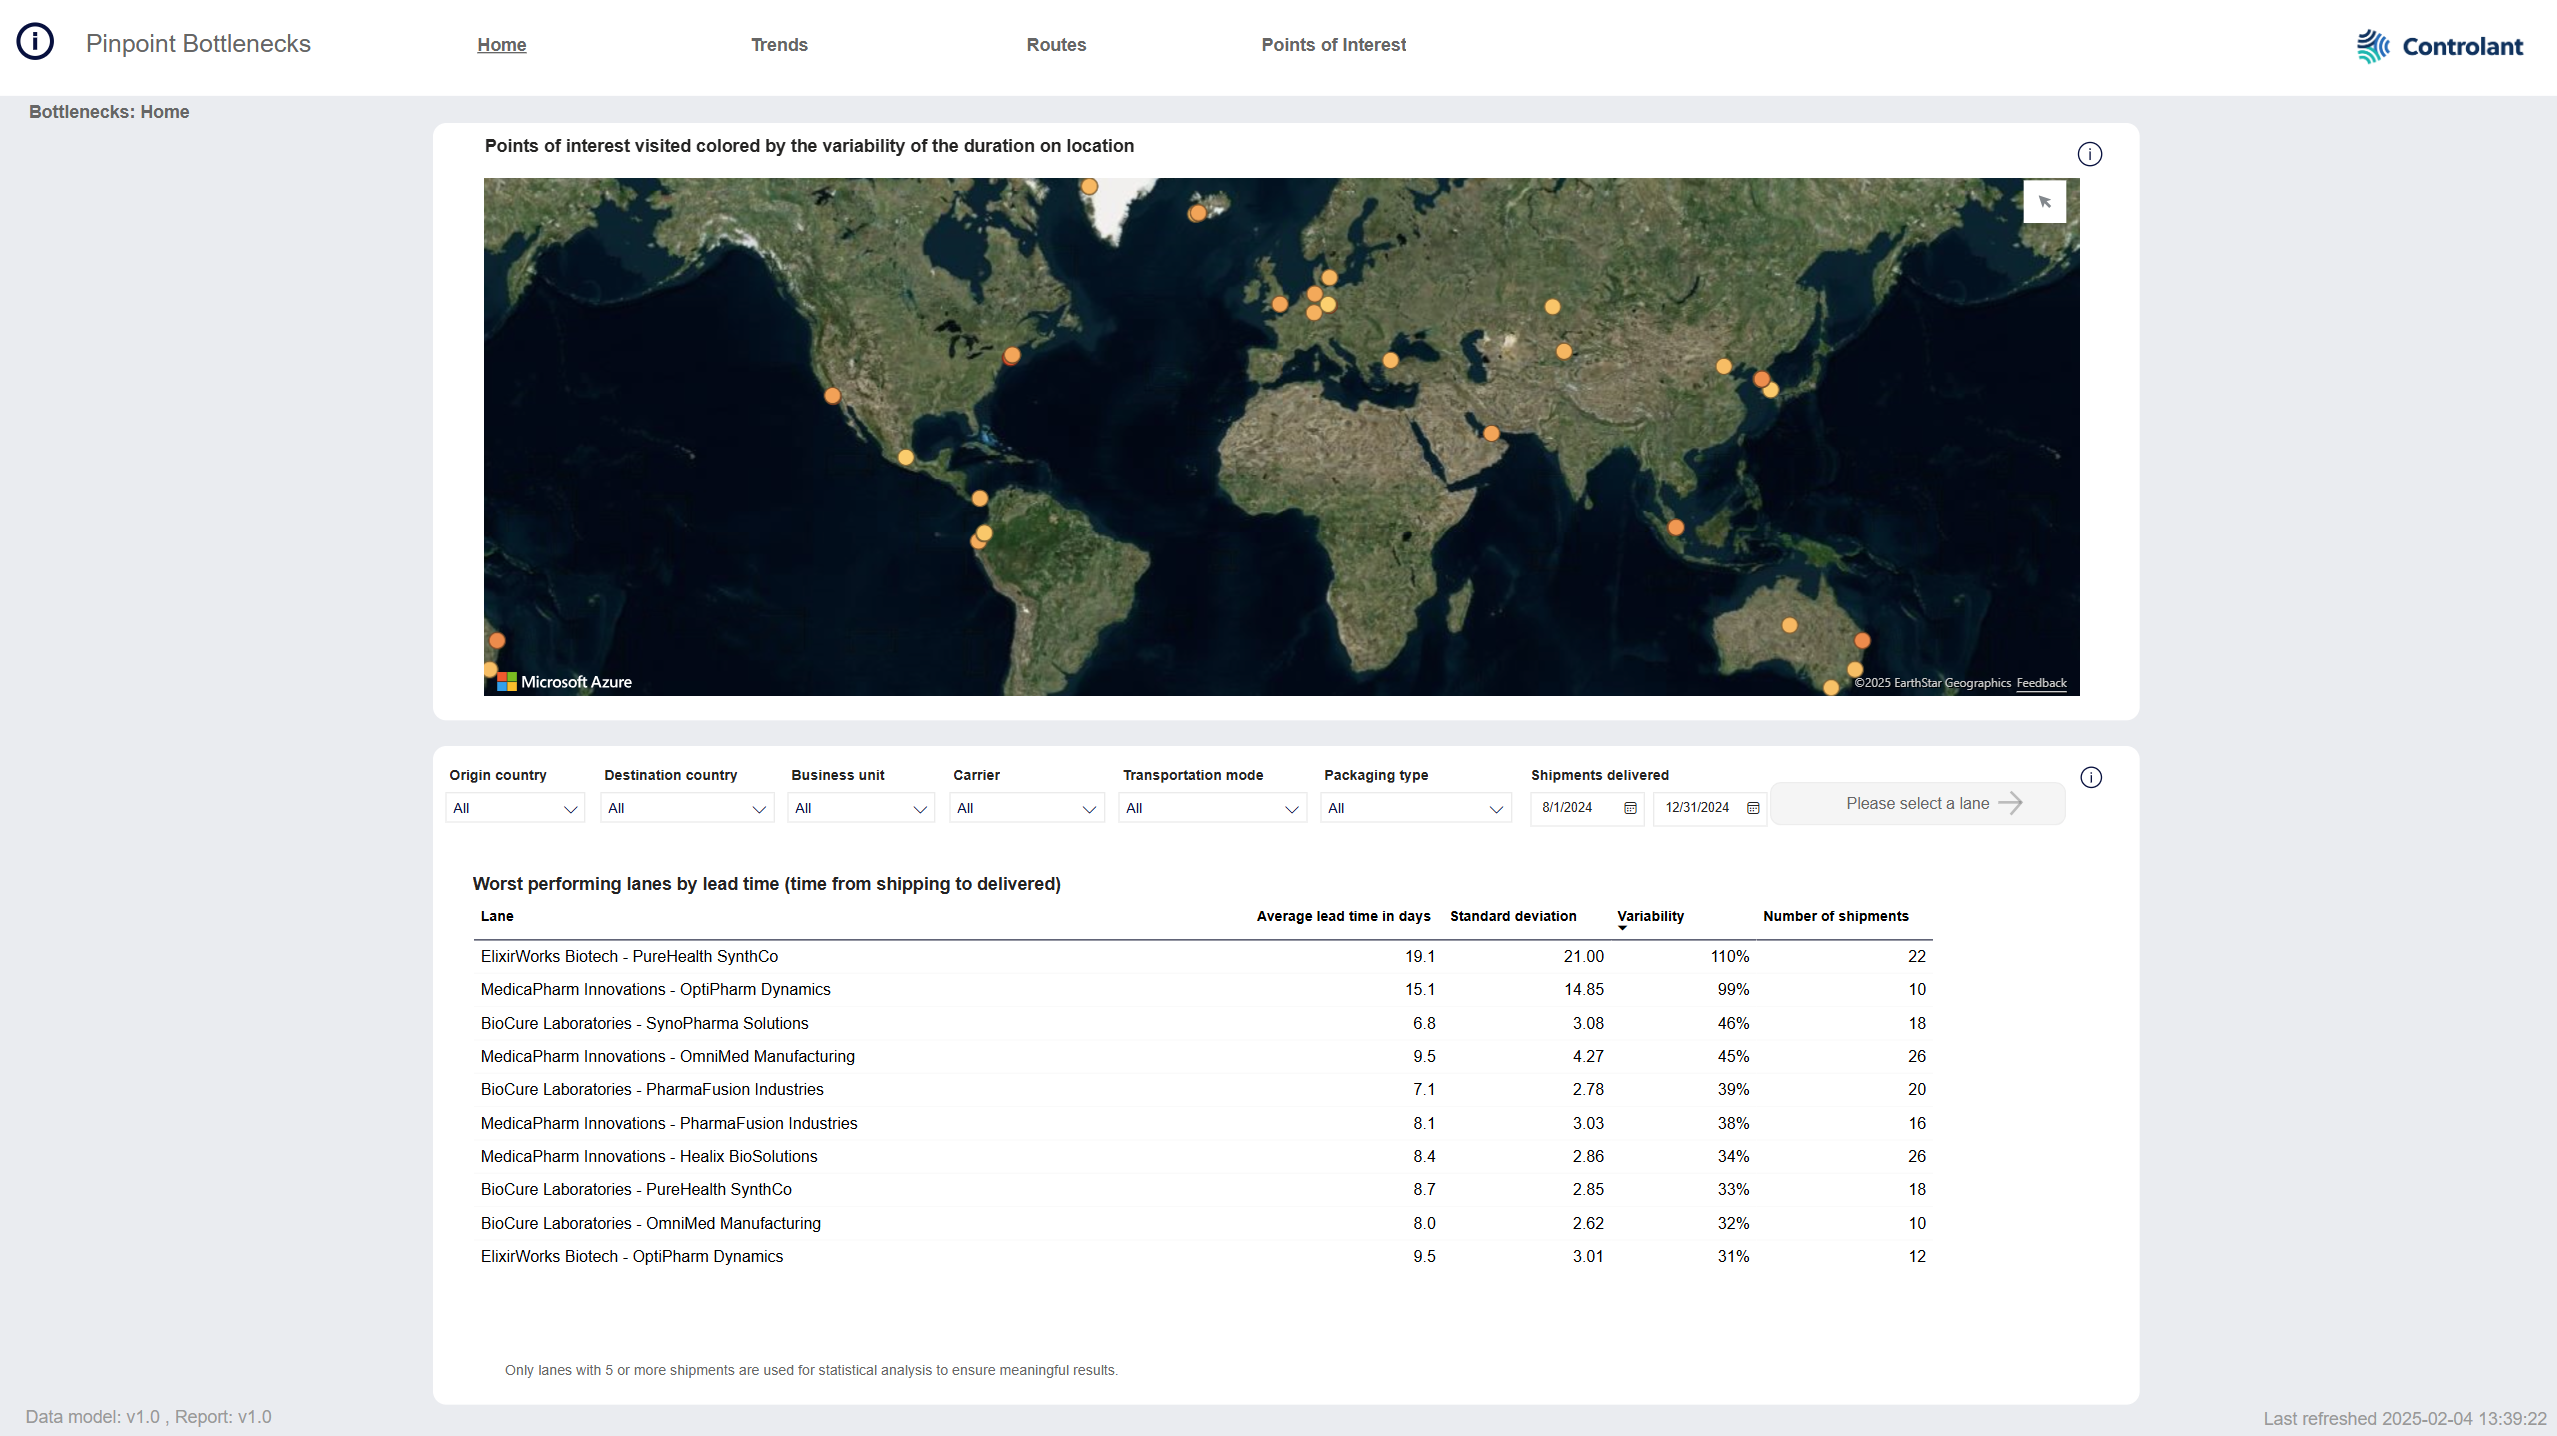
You can use Pinpoint Bottlenecks to identify the worst performing lanes and specific points of interest in your supply chain where shipments have excessive lead time and high lead time variability.
Inefficiencies in the supply chain, such as prolonged lead times and bottlenecks, result in significant challenges for pharmaceutical companies. These delays can disrupt production schedules, extend time-to-market, and increase operational costs, ultimately impacting patient access to critical medicines.
Please reach out to your Customer Success Manager for a product demo and information about the pricing of Pinpoint Excursions.
For more information, see Pinpoint Bottlenecks.
New features
The Home page shows bottleneck lanes; the top 10 high volume lanes that have the longest lead times:
Interactive map showing points of interest (POIs) with excursions for the 10 worst performing lanes.
Color of dots indicates duration of visits: Yellow indicates a shorter duration, orange indicates a longer.
Details about the worst performing lanes by lead time variability.
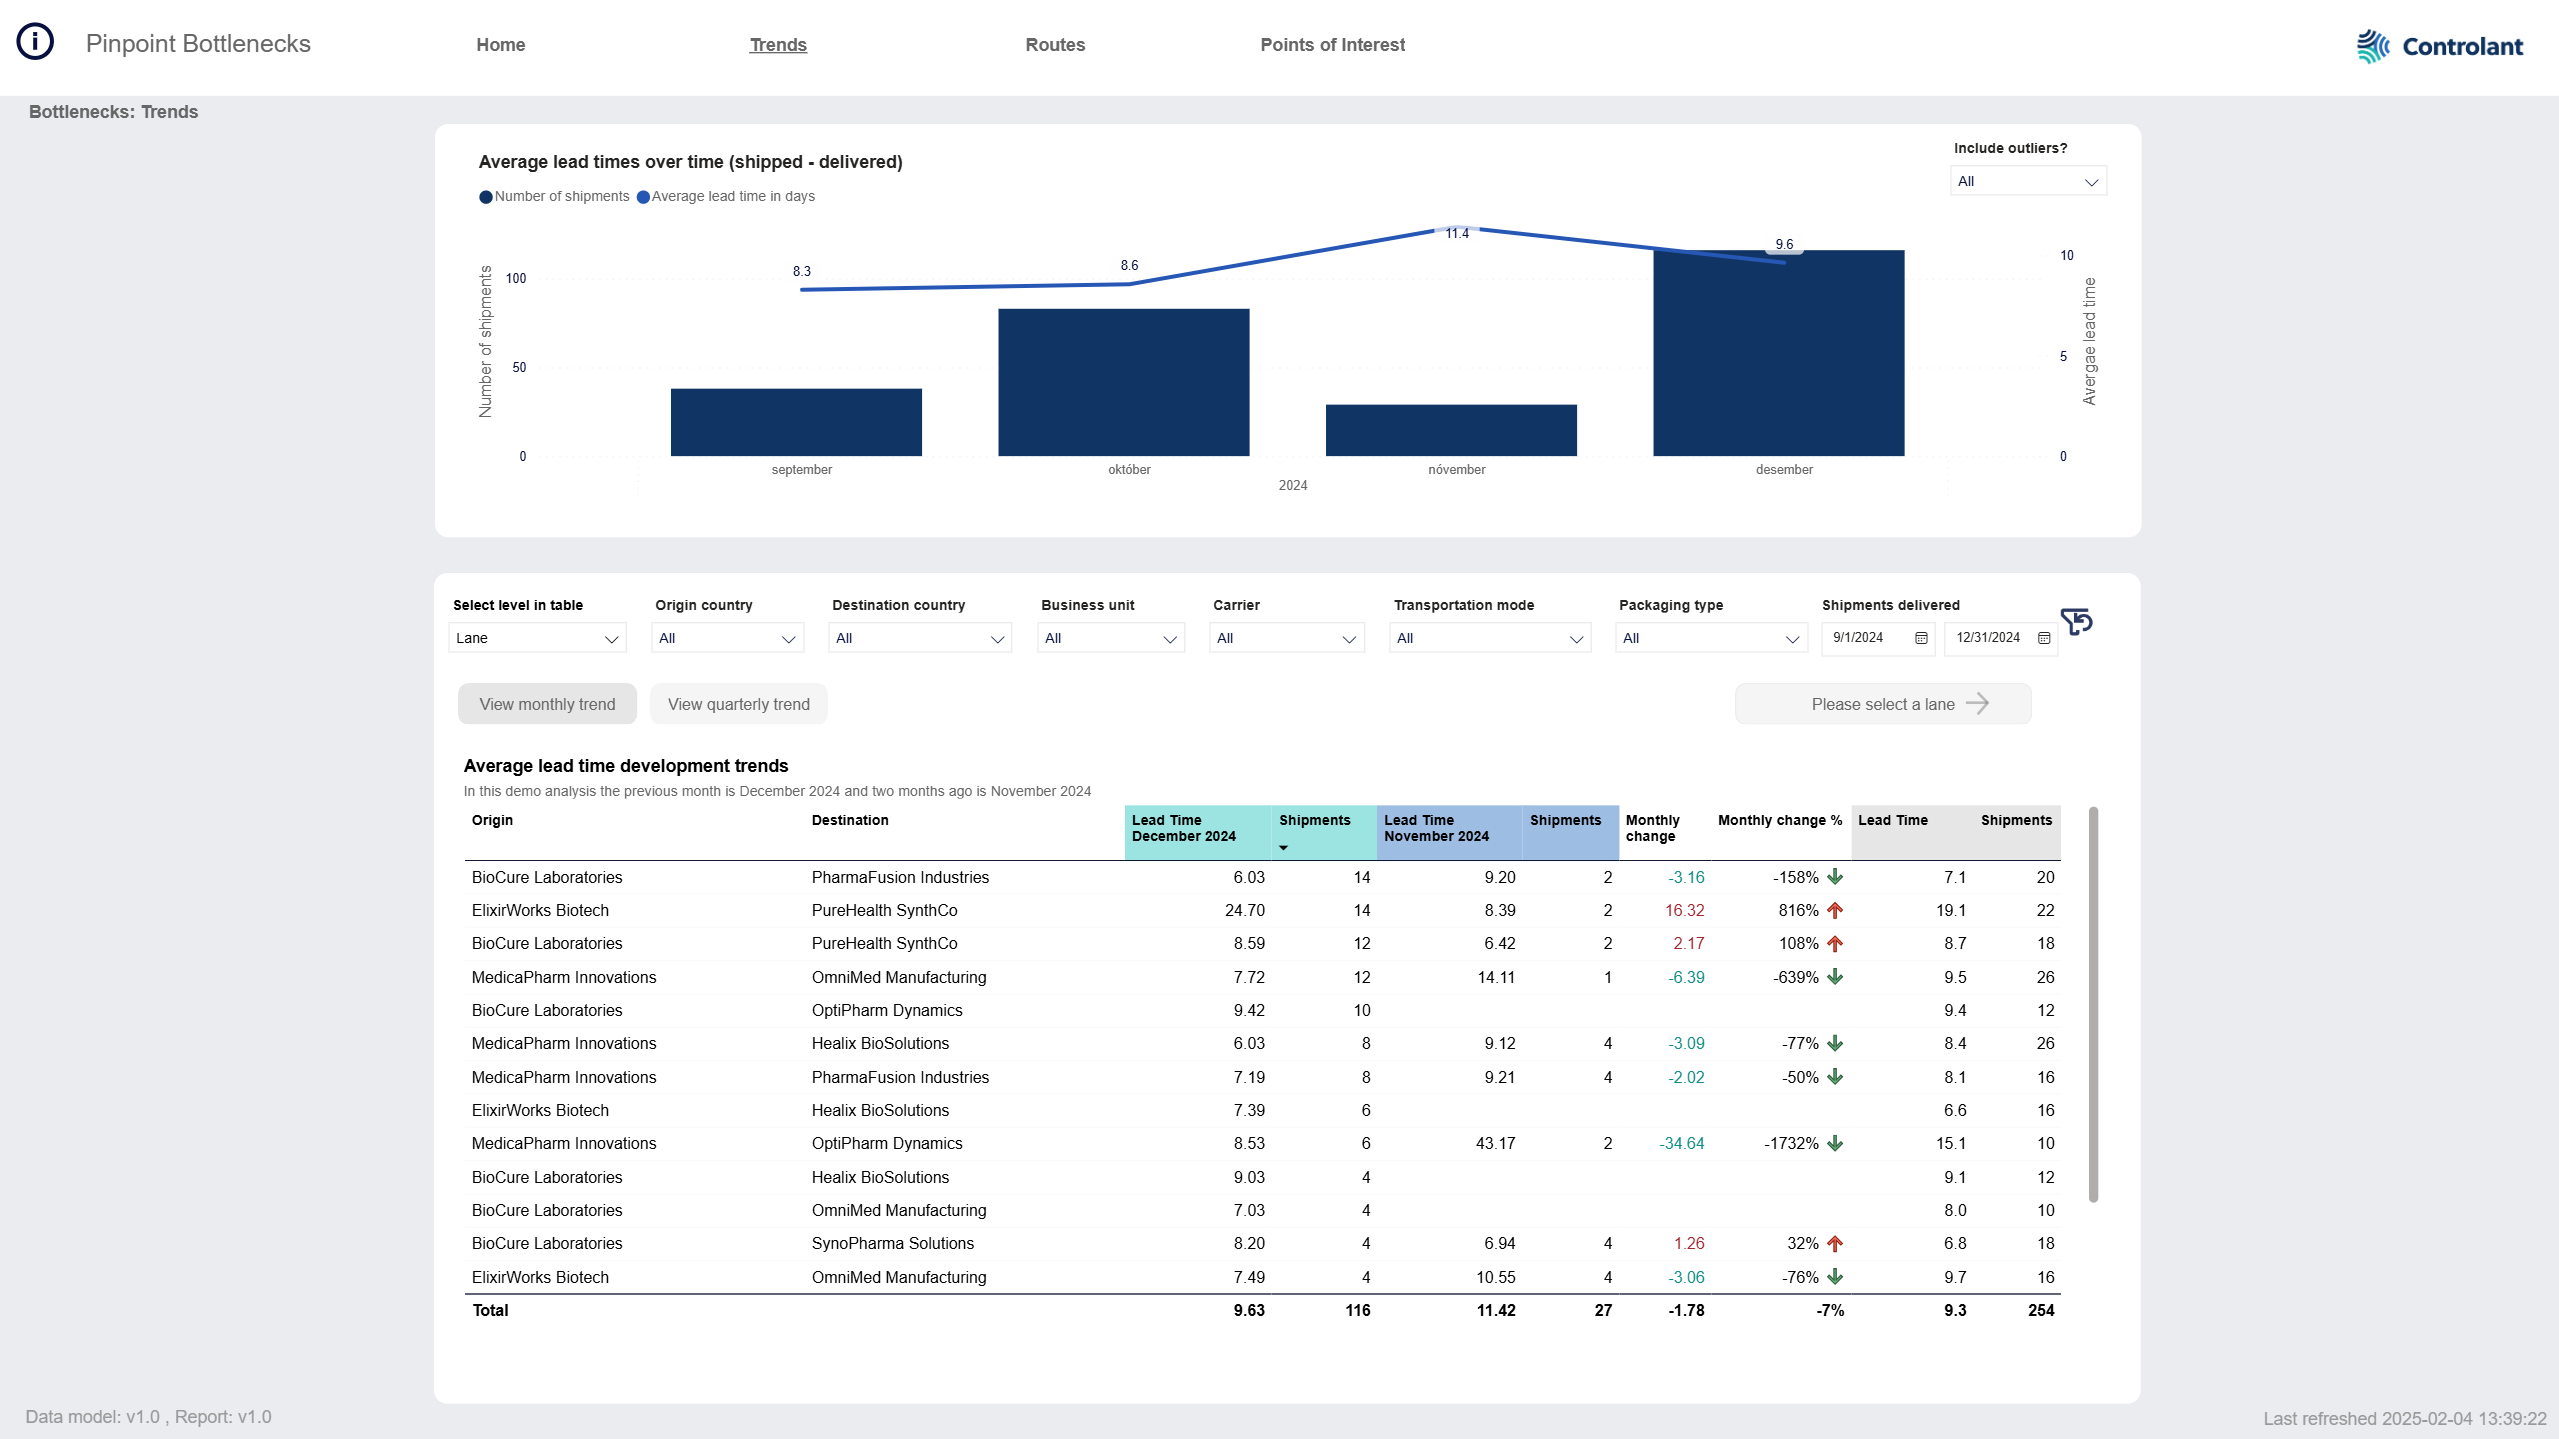
The Trends page shows trends in lead times for shipments over months or quarters:
Graph showing number of shipments and average lead times over time.
Trends by level:
lane (origin and destination locations)
routes
country-to-country
Trends by time:
monthly
quarterly
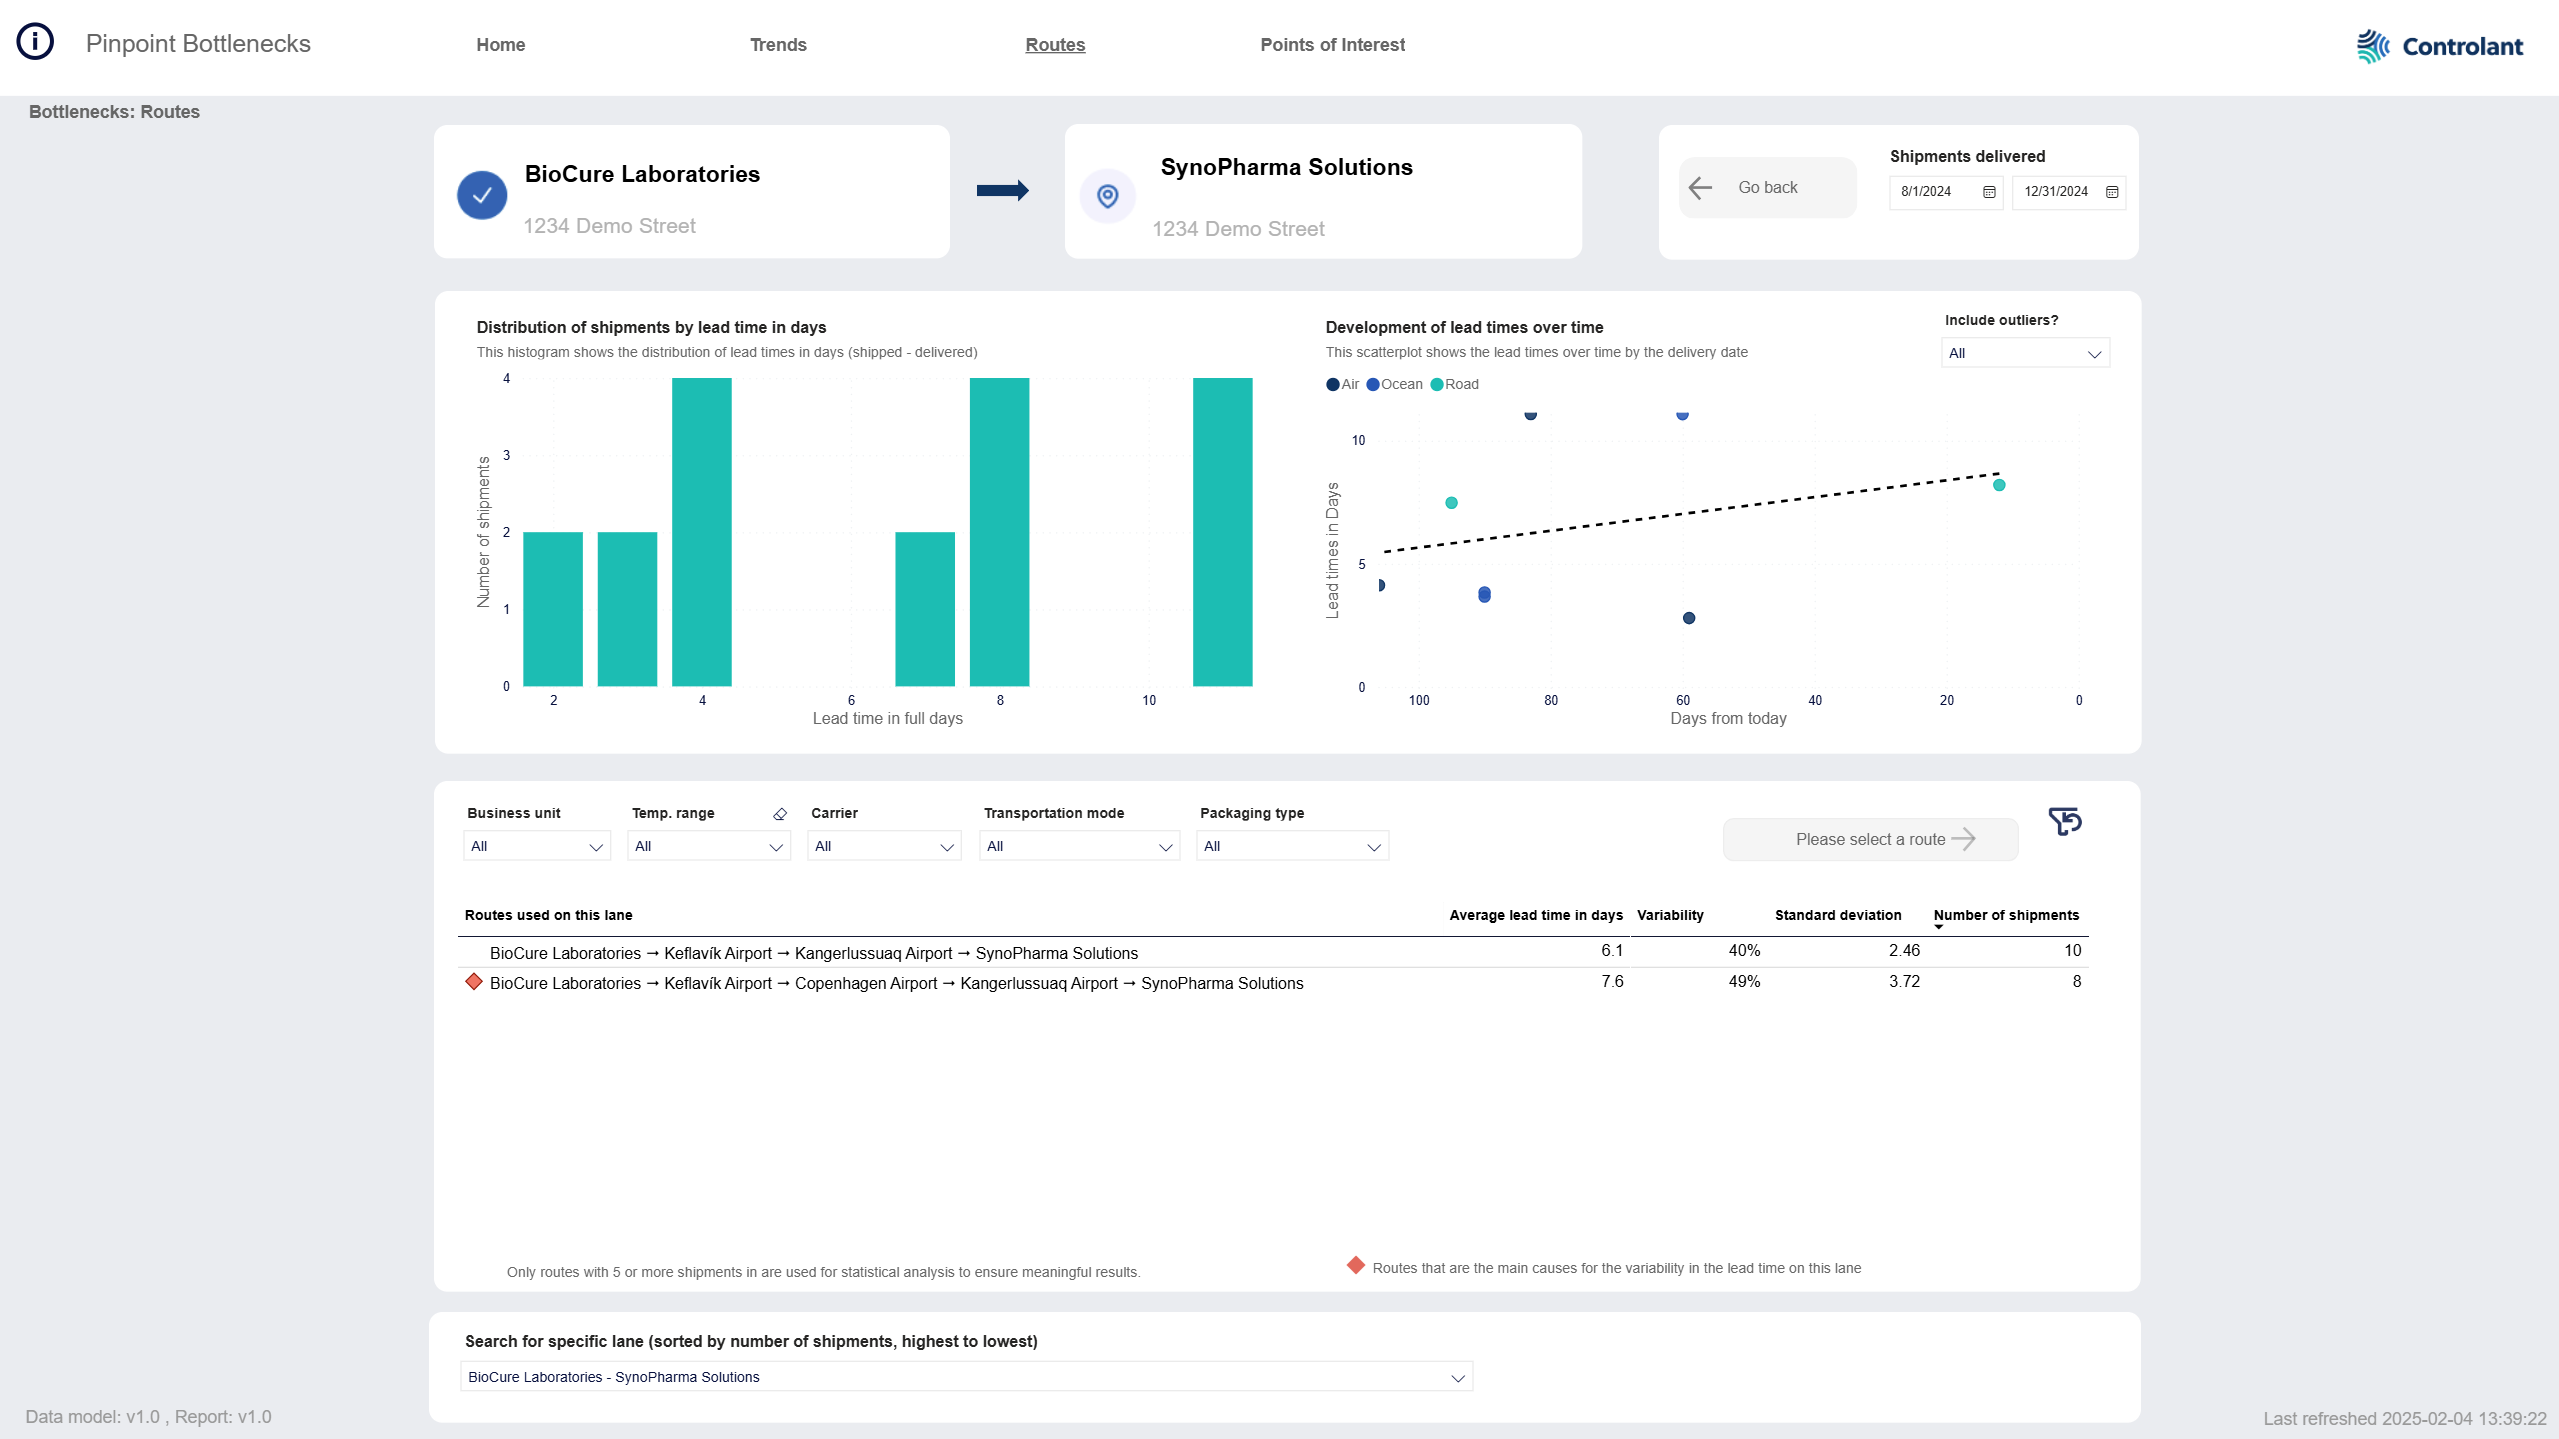
The Routes page shows details about the lead times on a selected lane:
Graph showing distribution of shipments by lead time in days.
Graph showing development of lead times over time.
Details about the worst bottleneck routes for the selected lane.
Route Analysis
The Route analysis page shows detailed analysis of the selected route.
Shipment details page
The Shipment details page contains a list of all shipments on the selected route.
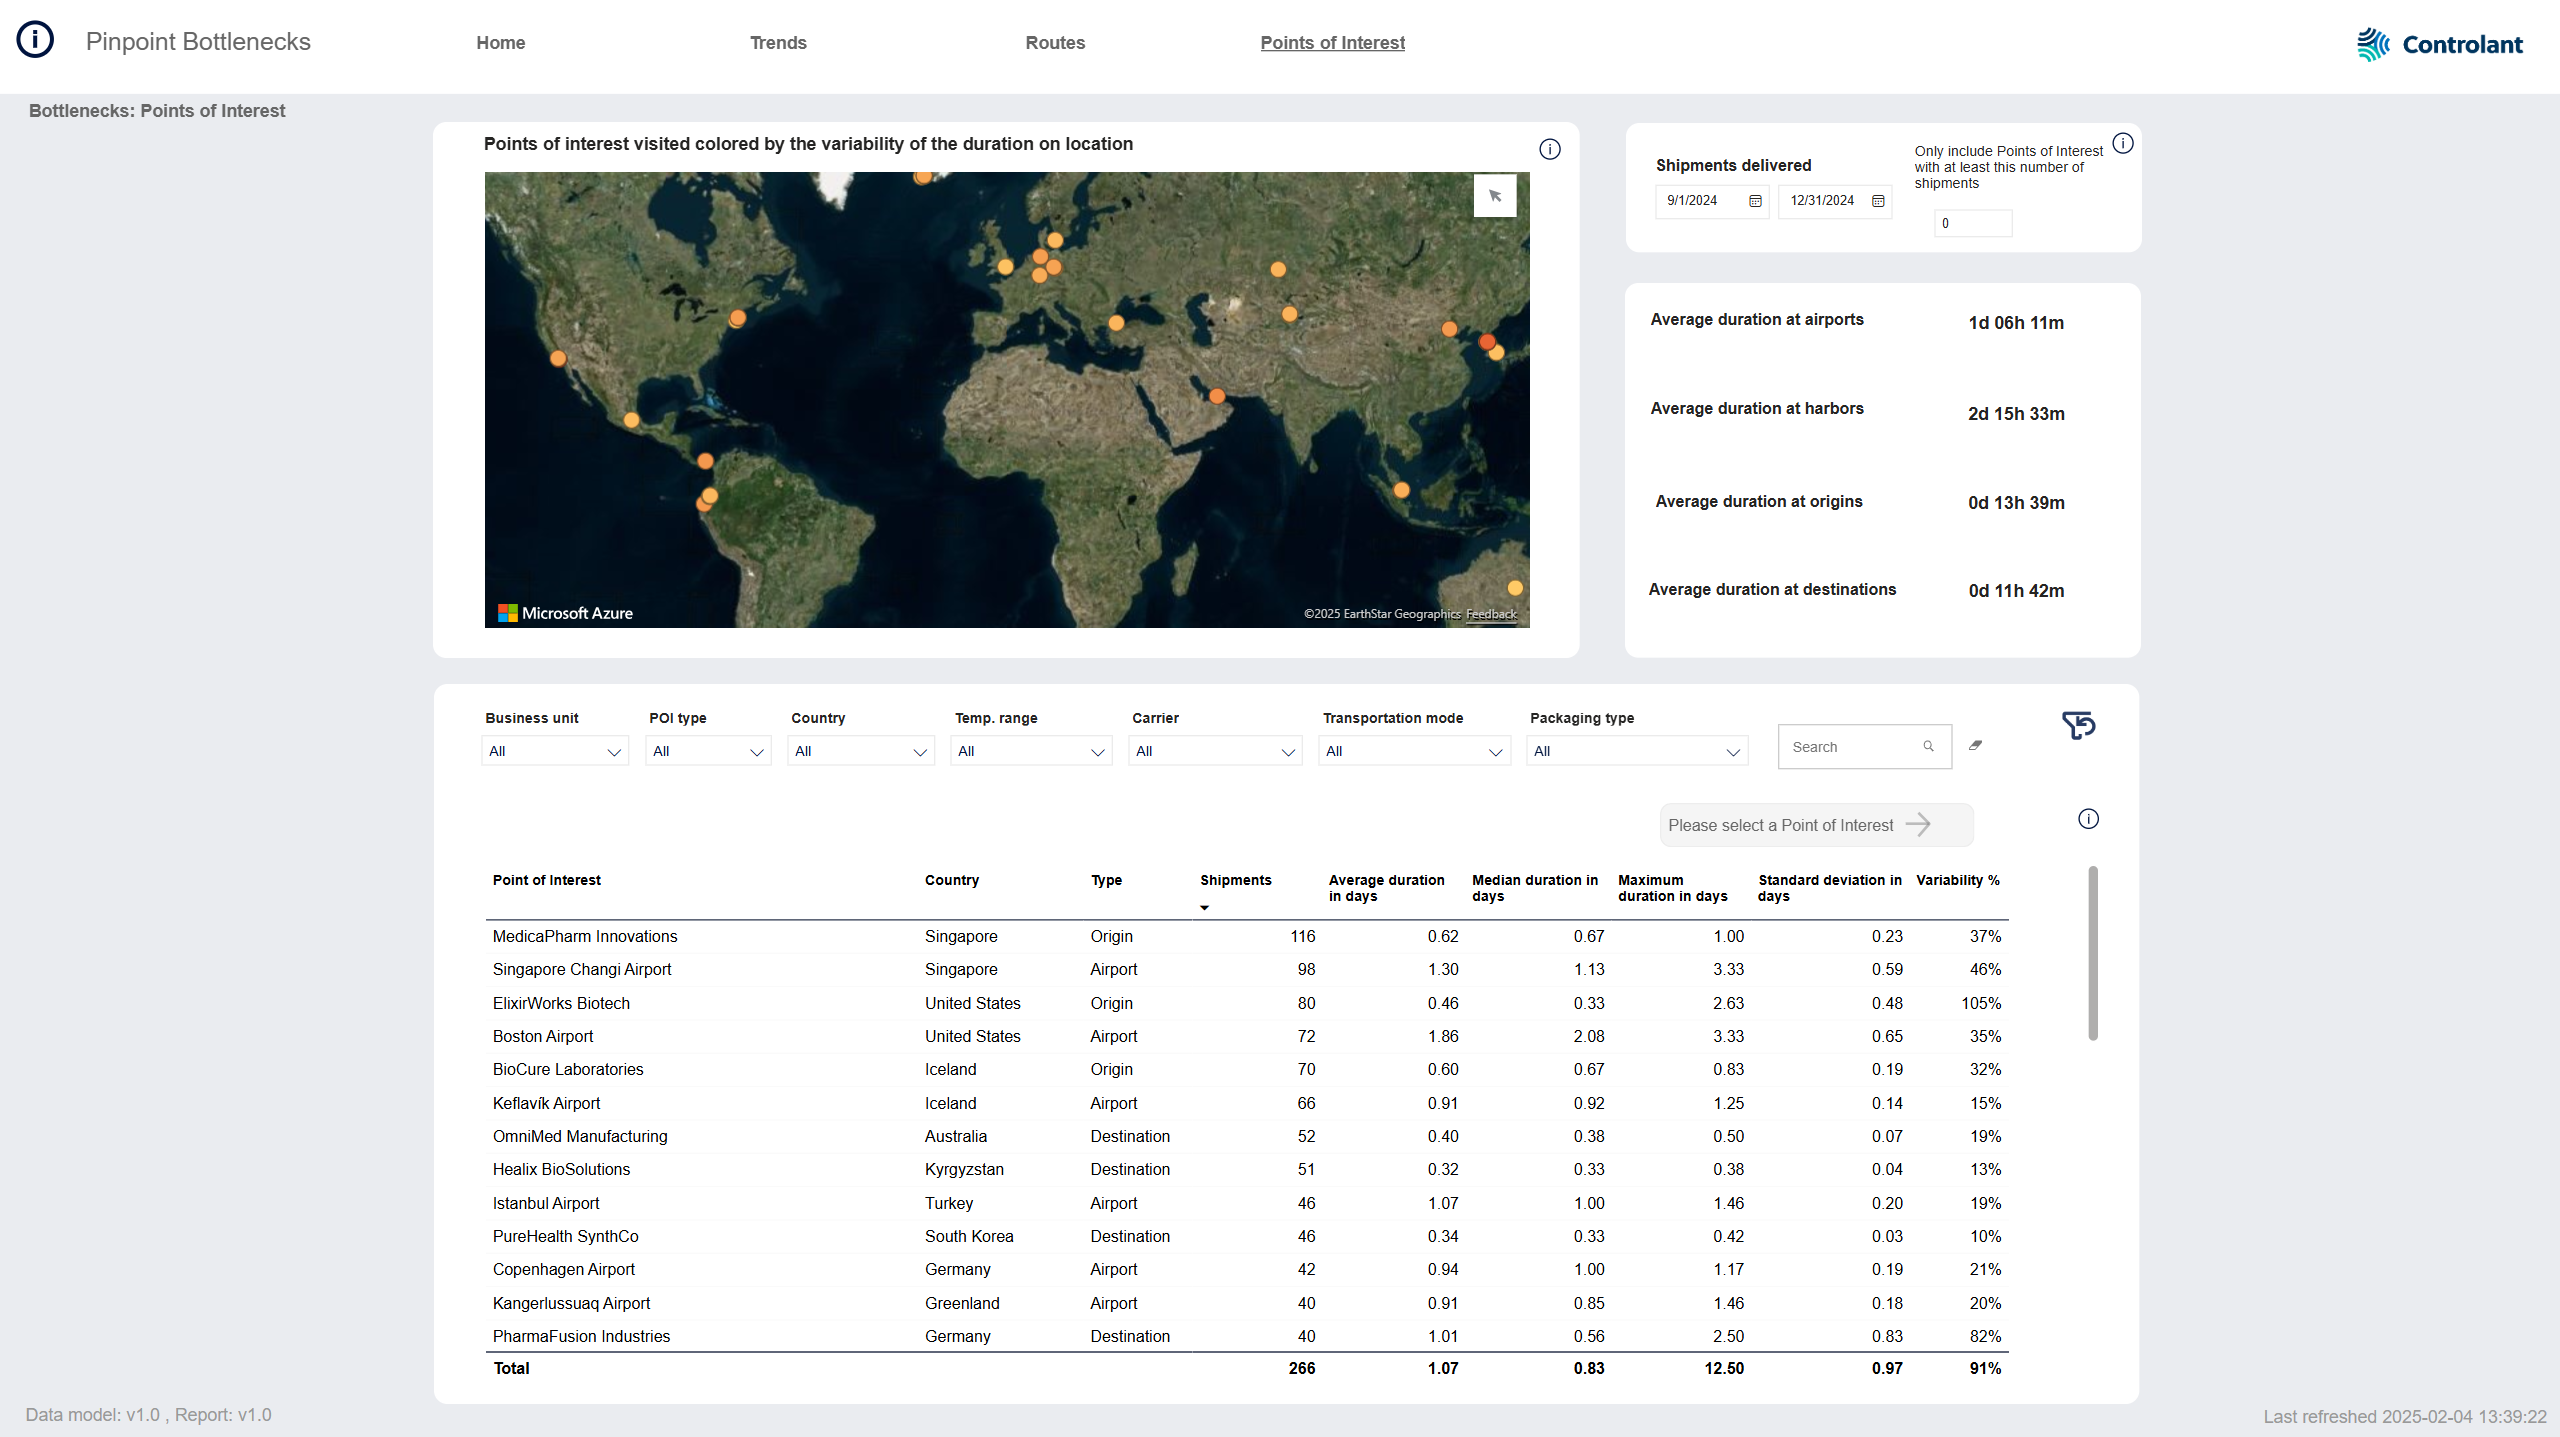
The Points of interest page shows details about lead times at specific points of interest (POIs):
Interactive map showing location of POIs where shipments have gone through with color of dot indicating duration of stay at the location.
Key point indicators for POIs:
average duration of stop at airports
average duration of stop at harbors
average duration of stop at origin locations
average duration of stop at destination locations
List of all POIs with details about duration of stay
Points of interest analysis
The Points of interest analysis page shows detailed analysis of the selected point of interest.