Trends
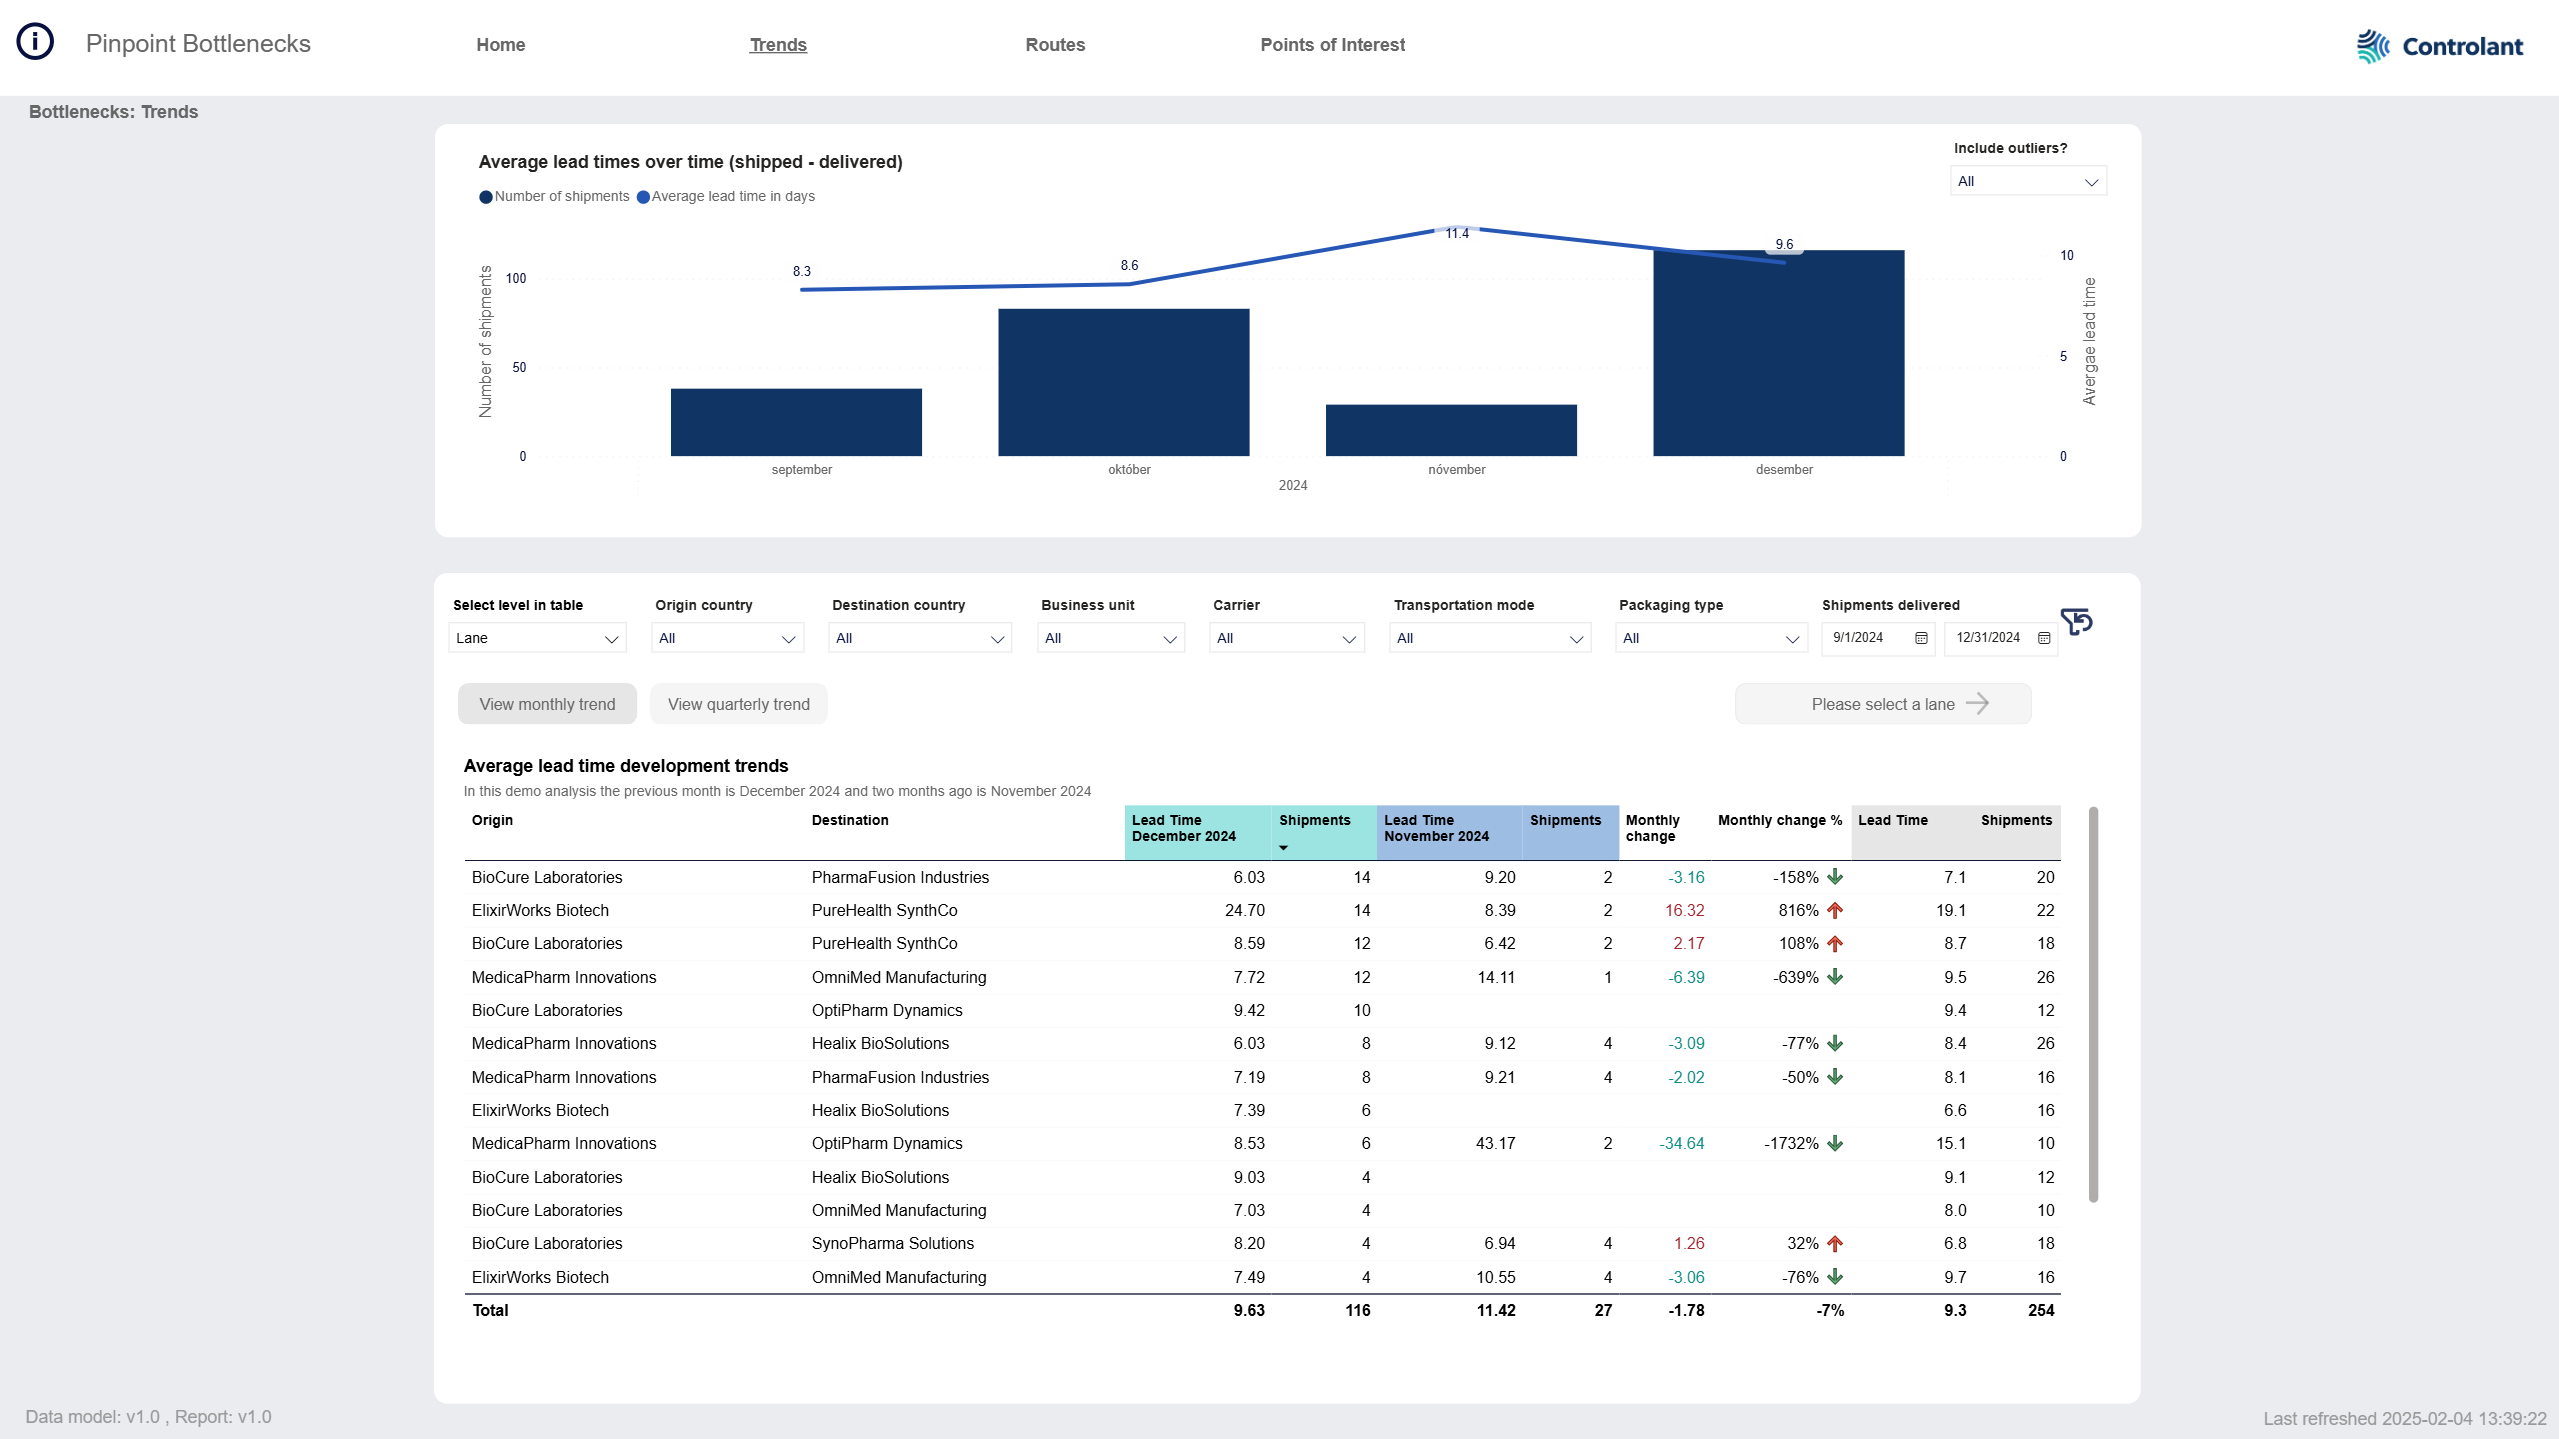
The Trends page shows trends in lead times for shipments over months or quarters.
Graph showing number of shipments and average lead times over time.
Trends by level:
lane (origin and destination locations)
routes
country-to-country
Trends by time:
monthly
quarterly
To open the Trends page, in the menu, click Trends.
Graph showing number of shipments and average lead times over time - by month or quarter.
The bars show number of shipments and the line shows the average lead times in days as a line. This allows you to observe trends over time. It provides a view of how shipment volumes and lead times fluctuate month by month, helping to identify seasonal patterns or anomalies.
Tip
You can use the Include outliers filter to view data only for outliers or data excluding outliers:
All - shows data for all lanes.
Exclude outliers - shows data for lanes that are not outliers.
Only outliers - shows data for lanes that are outliers.
Your selection will affect all data on the page.
Item | Description |
|---|---|
y axis - - Number of shipments - Average lead time | Trend of the following, for the period (month/quarter):
NoteLead time is the time from when a shipment starts shipping until it is delivered in the Controlant Platform (SCM). |
x axis Time | Unit of time. Depending on what is selected in the Average lead time development trends table, one of the following:
|
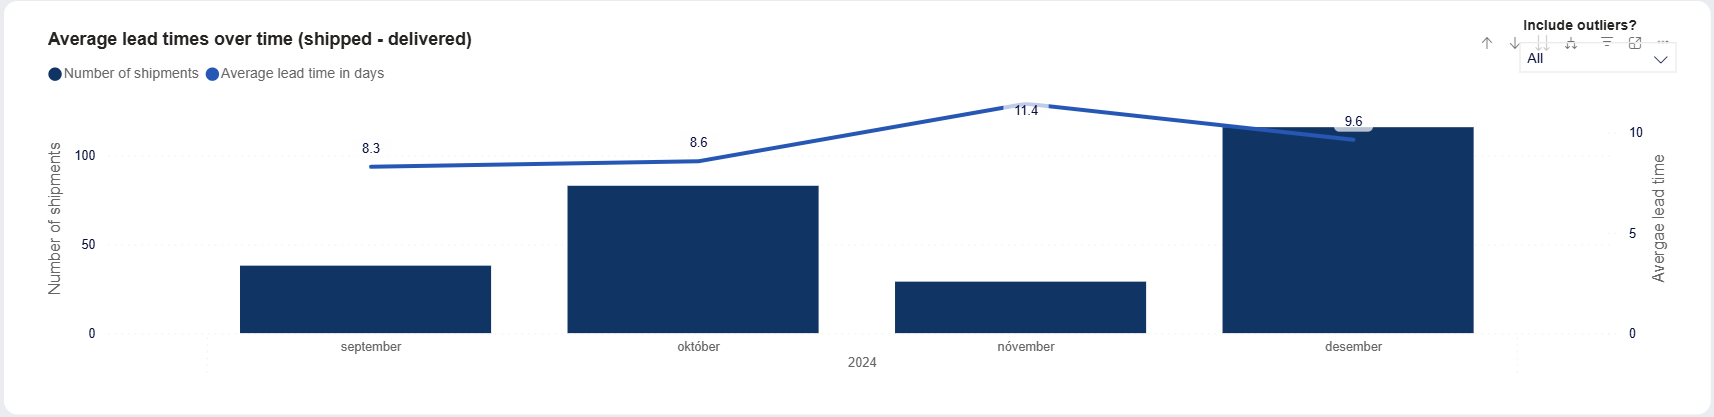
Detailed trends by origin and destination, routes or country-to-country data.
The table displays the average lead times for the previous month and two months ago, the variance between these periods, and the overall average lead time. To view quarterly trends instead, users can click the button above the graph to switch the layout to quarters.
Tip
You can use the Include outliers filter to view data only for outliers or data excluding outliers:
All - shows data for all lanes.
Exclude outliers - shows data for lanes that are not outliers.
Only outliers - shows data for lanes that are outliers.
Your selection will affect all data on the page.
Drill through selected lane

If you have selected to view the data on the lane level or route level, you can select a lane in the table below and click Learn more to view details about the selected lane in the Routes page.

You can filter the data in the table and on the Trends page.
The filters will affect the contents of the table as well as the graph above.
Note
Not all customers have the same filters. You may not see all of the following filters, or you may have filters not shown here.
Tip
To filter the list of options, start typing in the search field.
Tip
To clear the filter, click the eraser  .
.
Item | Description |
|---|---|
Select level in table | Configures the level of data shown in the table:
|
Origin country | Origin country of country/ lane/ route. Click to select, or press CTRL and click to select more than one from the list. |
Destination country | Destination country of country/ lane/ route. Click to select, or press CTRL and click to select more than one from the list. |
Business unit | Business unit of shipment, as configured in custom properties in Supply Chain Monitoring. |
Carrier | Name of carrier, as configured in custom properties in Supply Chain Monitoring. |
Transportation mode | Mode of transportation of shipment, as configured in custom properties in Supply Chain Monitoring. Click to select, or press CTRL and click to select more than one from the list. |
Packaging type | Type of packaging, as configured in custom properties in Supply Chain Monitoring. Click to select, or press CTRL and click to select more than one from the list. |
Shipments delivered | Date range shipment was delivered. Type a date, or click
|

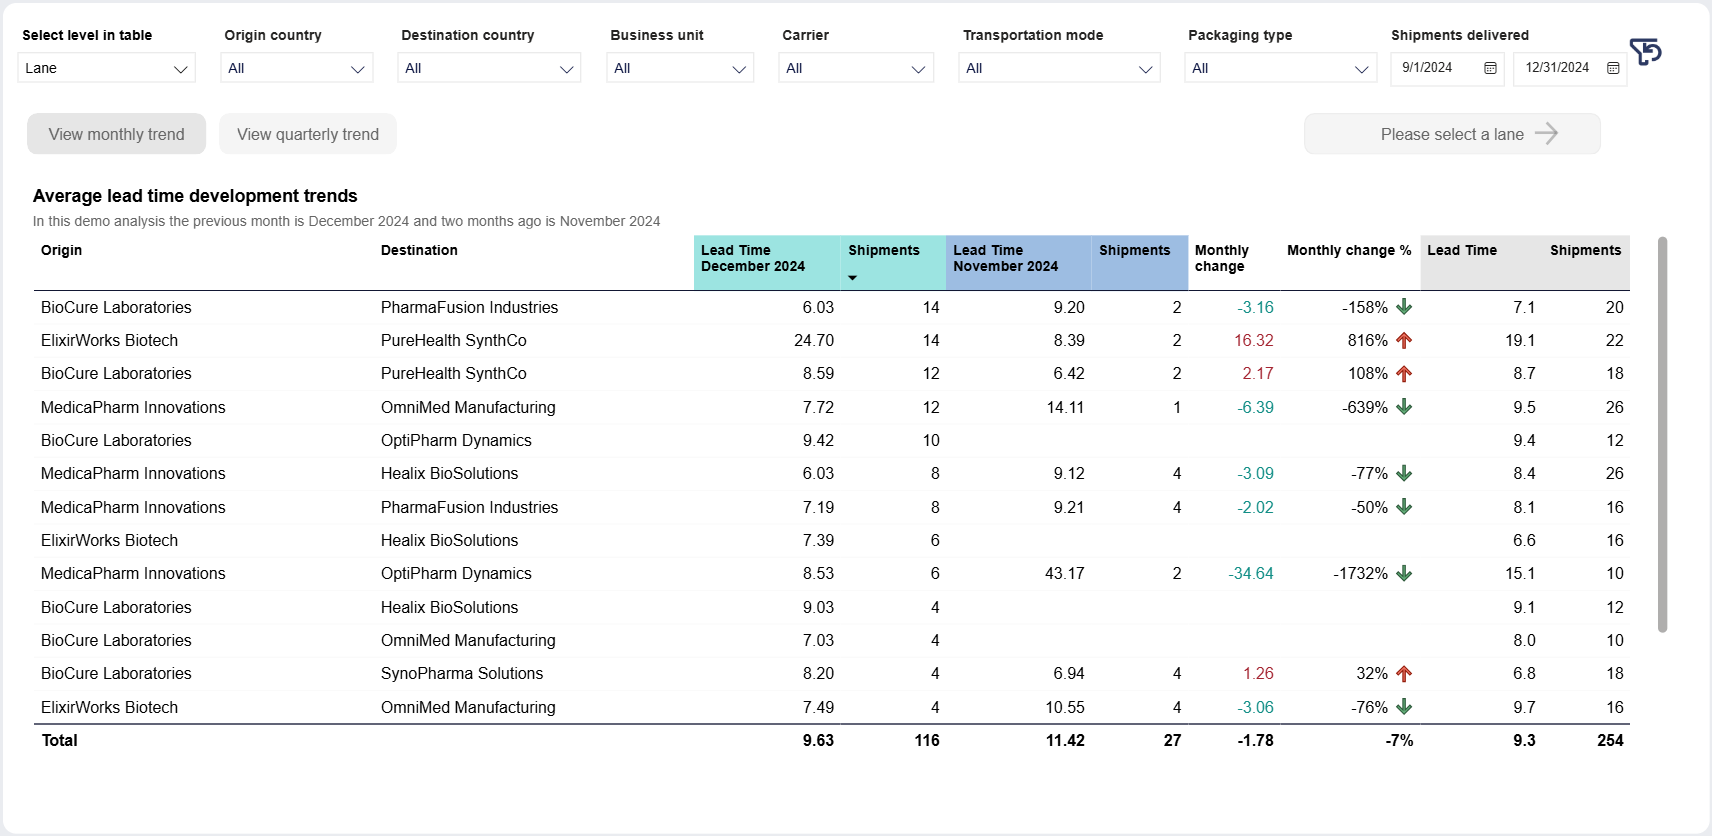
Average lead time development trends table
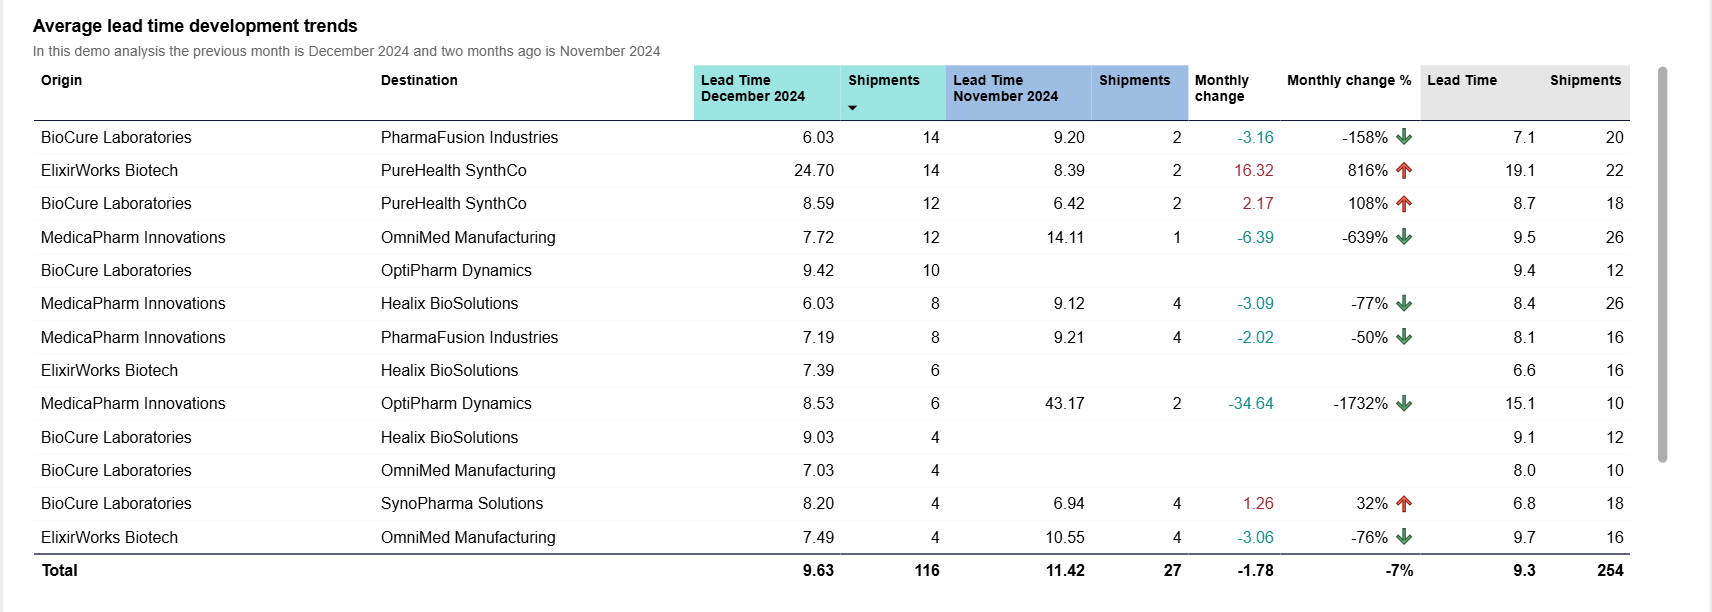
Average lead time development trends:
Trends by level:
lane (origin and destination locations)
routes
country-to-country
Trends by time:
monthly
quarterly
You can do the following with data in tables:
Export data:
Export the data with the current layout
Export summarized data:
as a comma separated values file, .csv
as an Excel file, .xlsx
Show as a table
Spotlight
Get insights
Sort descending
Sort ascending
Sort by column
Tip
You can click any column header to sort the contents of the table by the contents of that column. An arrow indicates the column the table is sorted by: An arrow pointing up indicates ascending order, and an arrow pointing down indicates descending order. Click the column header to toggle between the two.
Item | Description | |
|---|---|---|
If you selected From-To Country above | ||
From Country | Origin country of shipments. | |
To Country | Destination country of shipments. | |
If you selected Lane above | ||
Origin | Origin location of shipments. NoteA lane consists of a pair of origin and a destination locations of shipments. A route includes all the locations the shipment goes through on its way from origin to destination. A lane can contain multiple routes. | |
| Destination | Destination location of shipments. NoteA lane consists of a pair of origin and a destination locations of shipments. A route includes all the locations the shipment goes through on its way from origin to destination. A lane can contain multiple routes. |
If you selected Route above | ||
Route | Route of shipments. NoteA lane consists of a pair of origin and a destination locations of shipments. A route includes all the locations the shipment goes through on its way from origin to destination. A lane can contain multiple routes. | |
Current period | ||
| Lead time [date 1] | Average lead time of shipments in the current time period (last full month/ quarter), in days. NoteLead time is the time from when a shipment starts shipping until it is delivered in the Controlant Platform (SCM). |
| Shipments | Number of shipments in this level during this time. |
Previous period | ||
| Lead time [date 2] | Average lead time of shipments in the previous time period (month/ quarter before the last), in days. NoteLead time is the time from when a shipment starts shipping until it is delivered in the Controlant Platform (SCM). |
| Shipments | Number of shipments in this level during this time. |
Change between periods | ||
| Monthly change / Quarterly change | Change in average lead time between the periods, in days. NoteA negative number indicates the lead time has been reduced. A positive number indicates the lead time has increased. |
| Monthly change % / Quarterly change % | Change in average lead time between the periods, in percentage. NoteA negative number indicates the lead time has been reduced. A positive number indicates the lead time has increased. |
All selected | ||
| Lead time | Average lead time of all shipments at this level during the period selected in the Shipment delivered filter, in days. NoteLead time is the time from when a shipment starts shipping until it is delivered in the Controlant Platform (SCM). |
| Shipments | Number of shipments in this level during the period selected in the Shipment delivered filter, in days. |