Data tab
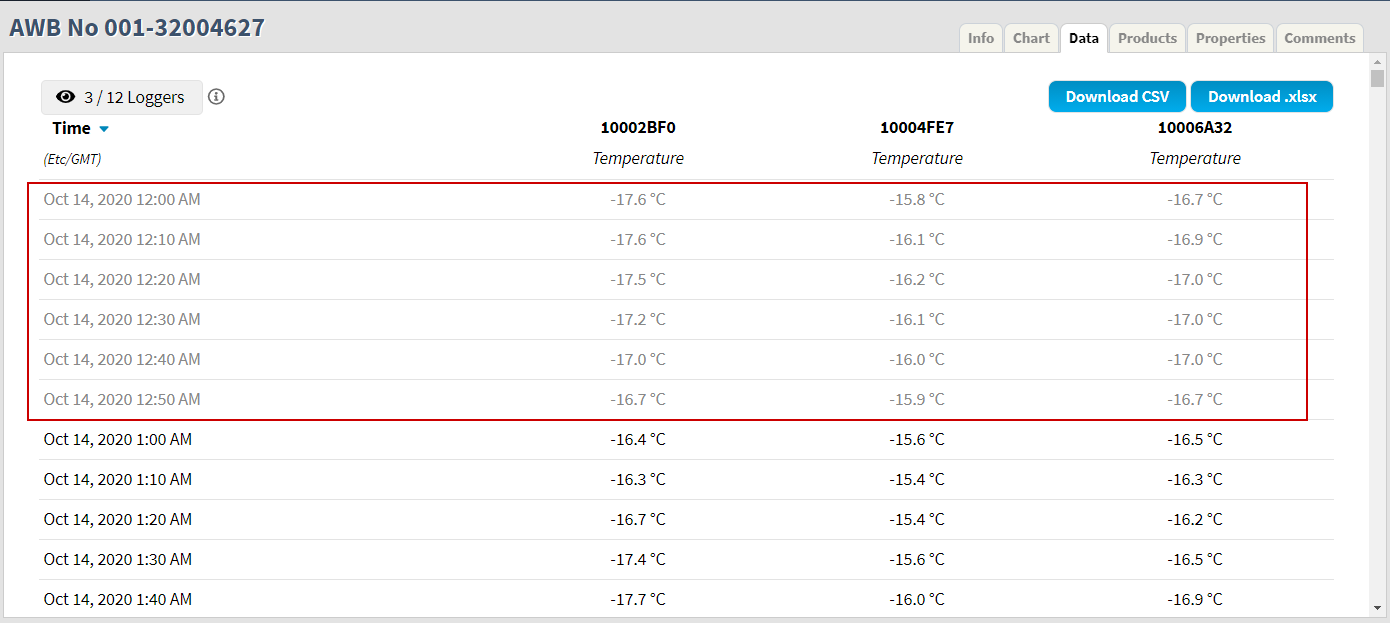
The Data tab contains the measurements for loggers in a tabular format.
Select loggers
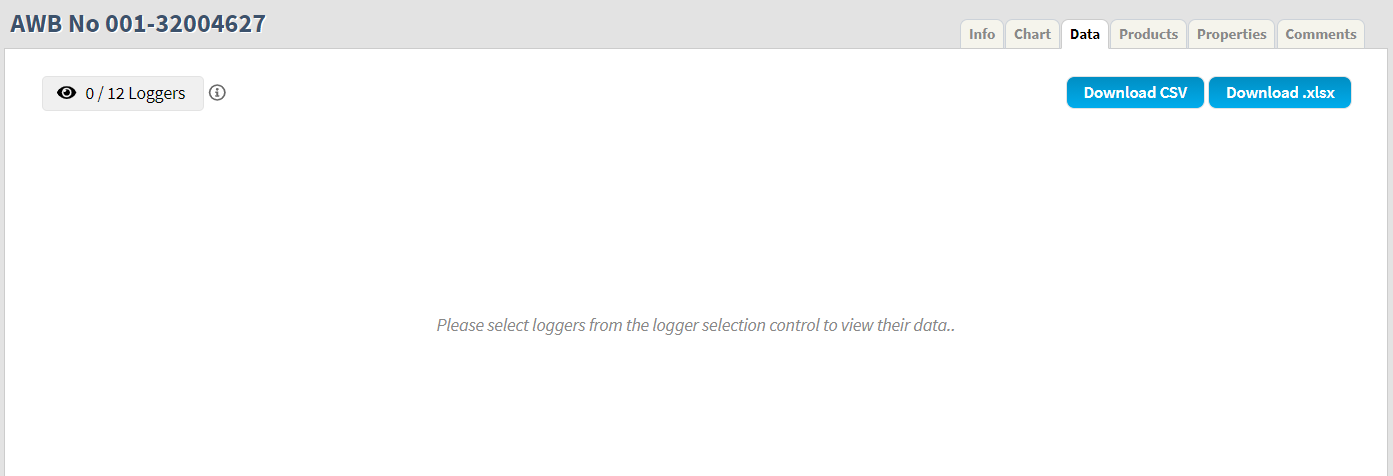
Upon initial load, no logger is selected and the Data tab displays an empty page.
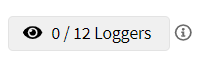
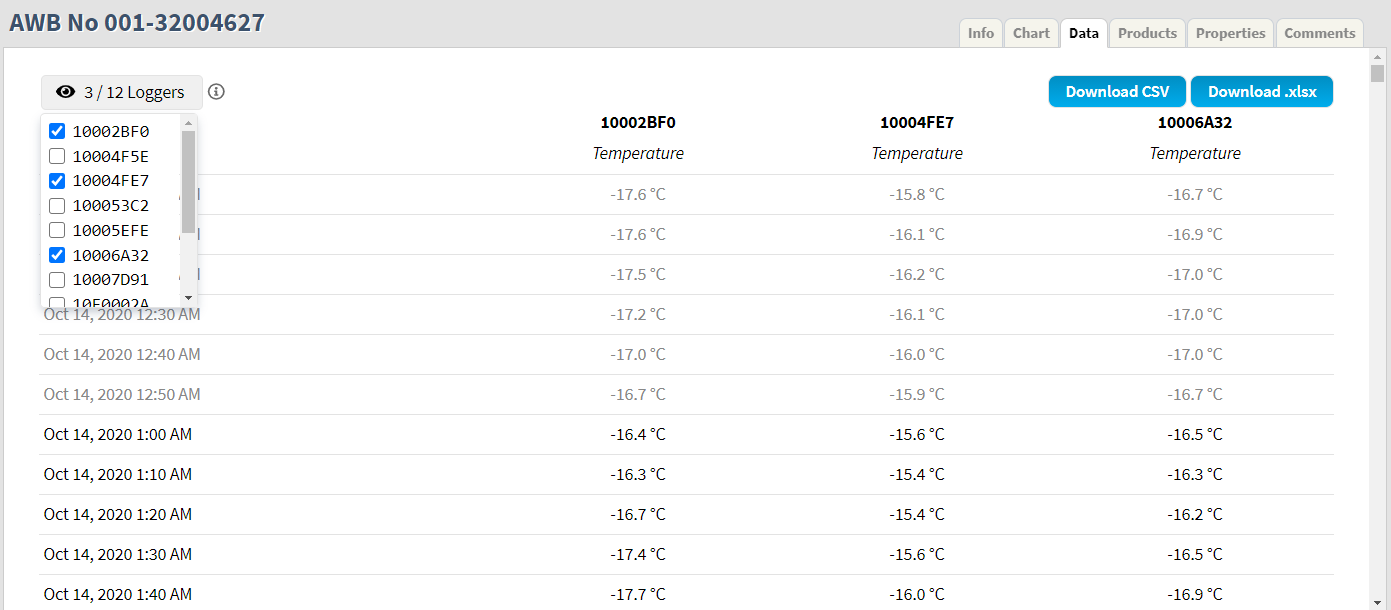
To select loggers to be displayed in the Data tab, click the Loggers button (see image below) in the top left corner.
Once selected, a drop-down menu listing the loggers that have been added to the shipment is shown. Select the loggers that are to be displayed using the checkboxes. Note that maximum of six (6) loggers can be selected.
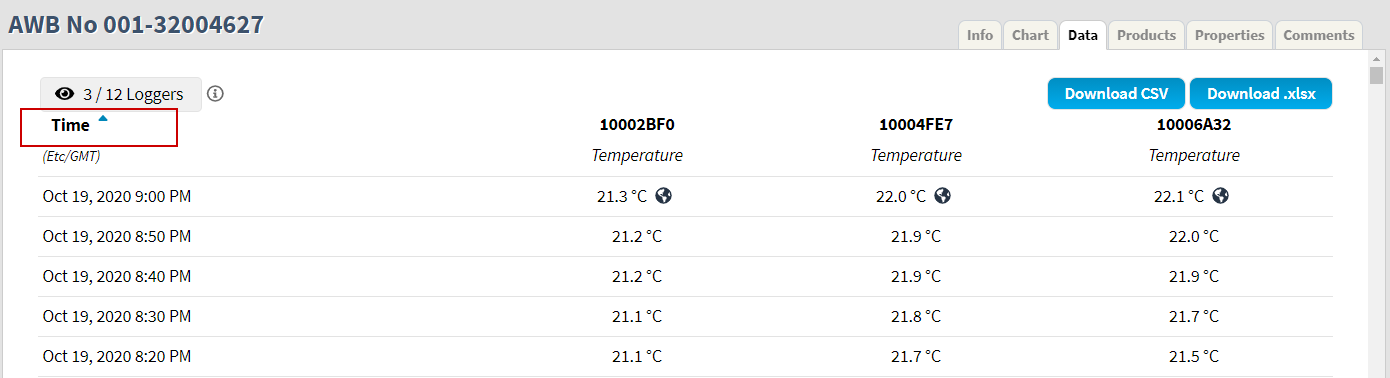
Sort data
By default, the data will appear in the displayed table and the loggers are sorted from the oldest to the newest. The data can be sorted in reversed order with the newest data points on top by clicking the Time column header.
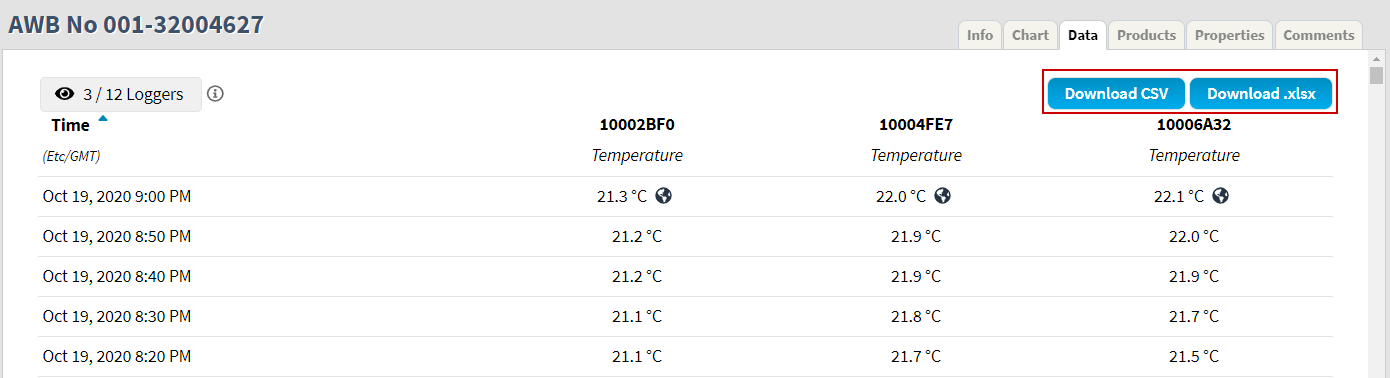
Download data
Download the raw data by using the Download buttons in the top right corner. Possible file formats are:
CSV (comma separated values)
.xlsx (Excel spreadhseet)
When downloading the data for the shipment, all data from all the loggers is included, regardless of what has been selected for display in the Data table.
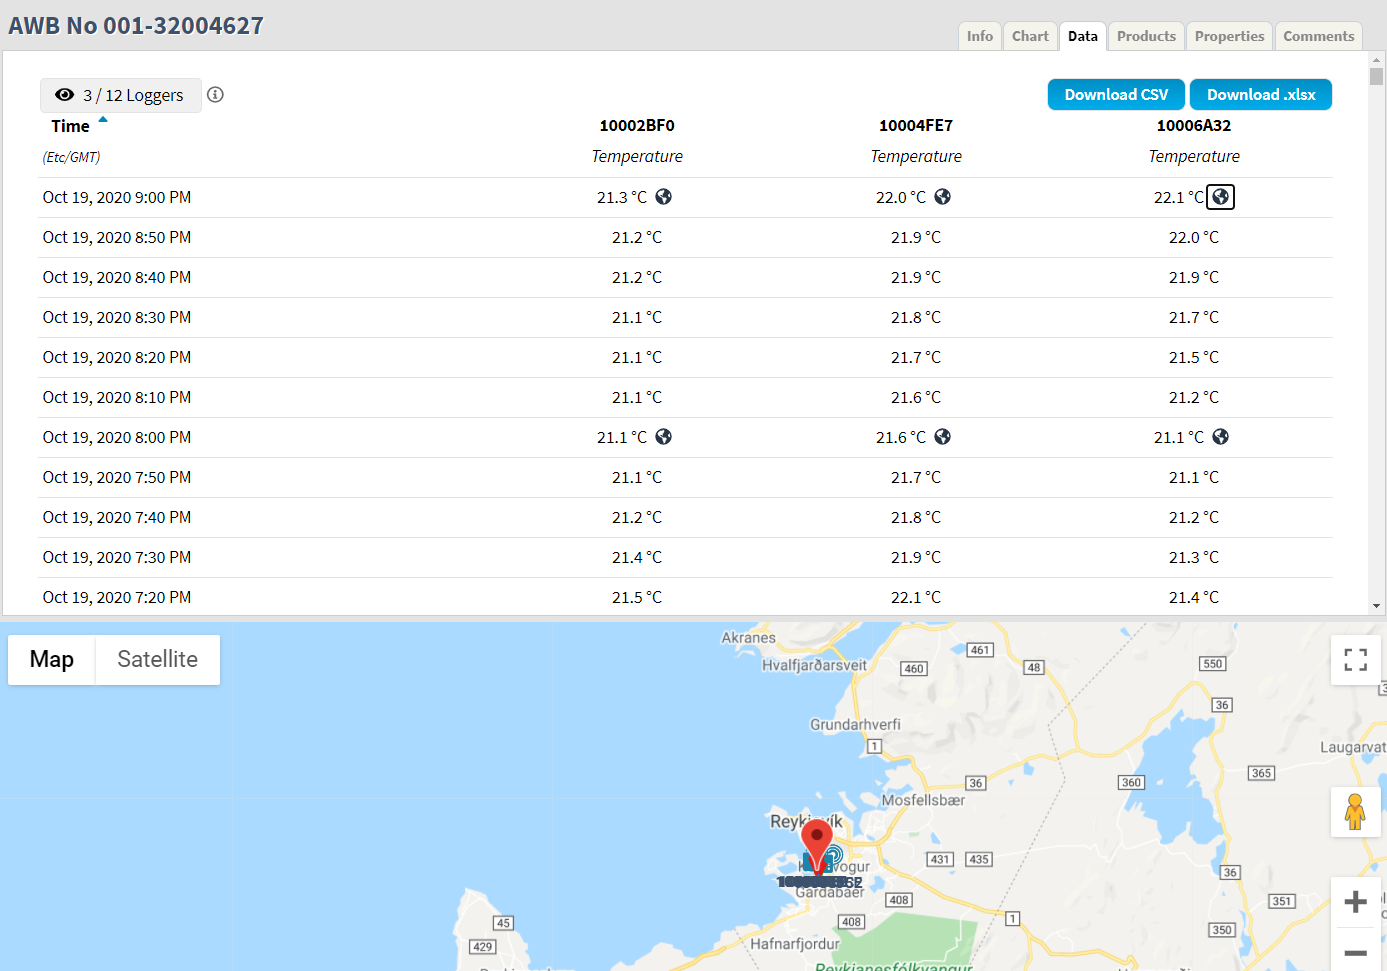
Location data
If a logger has reported its location at a given time, a globe icon is shown next to the corresponding temperature measurement.
By clicking the globe icon, a location pin is displayed on the map below showing the position where the measurement was recorded.
Ignore period
Measurements within a defined ignore period are indicated in the data table in a gray color.