Point of Interest
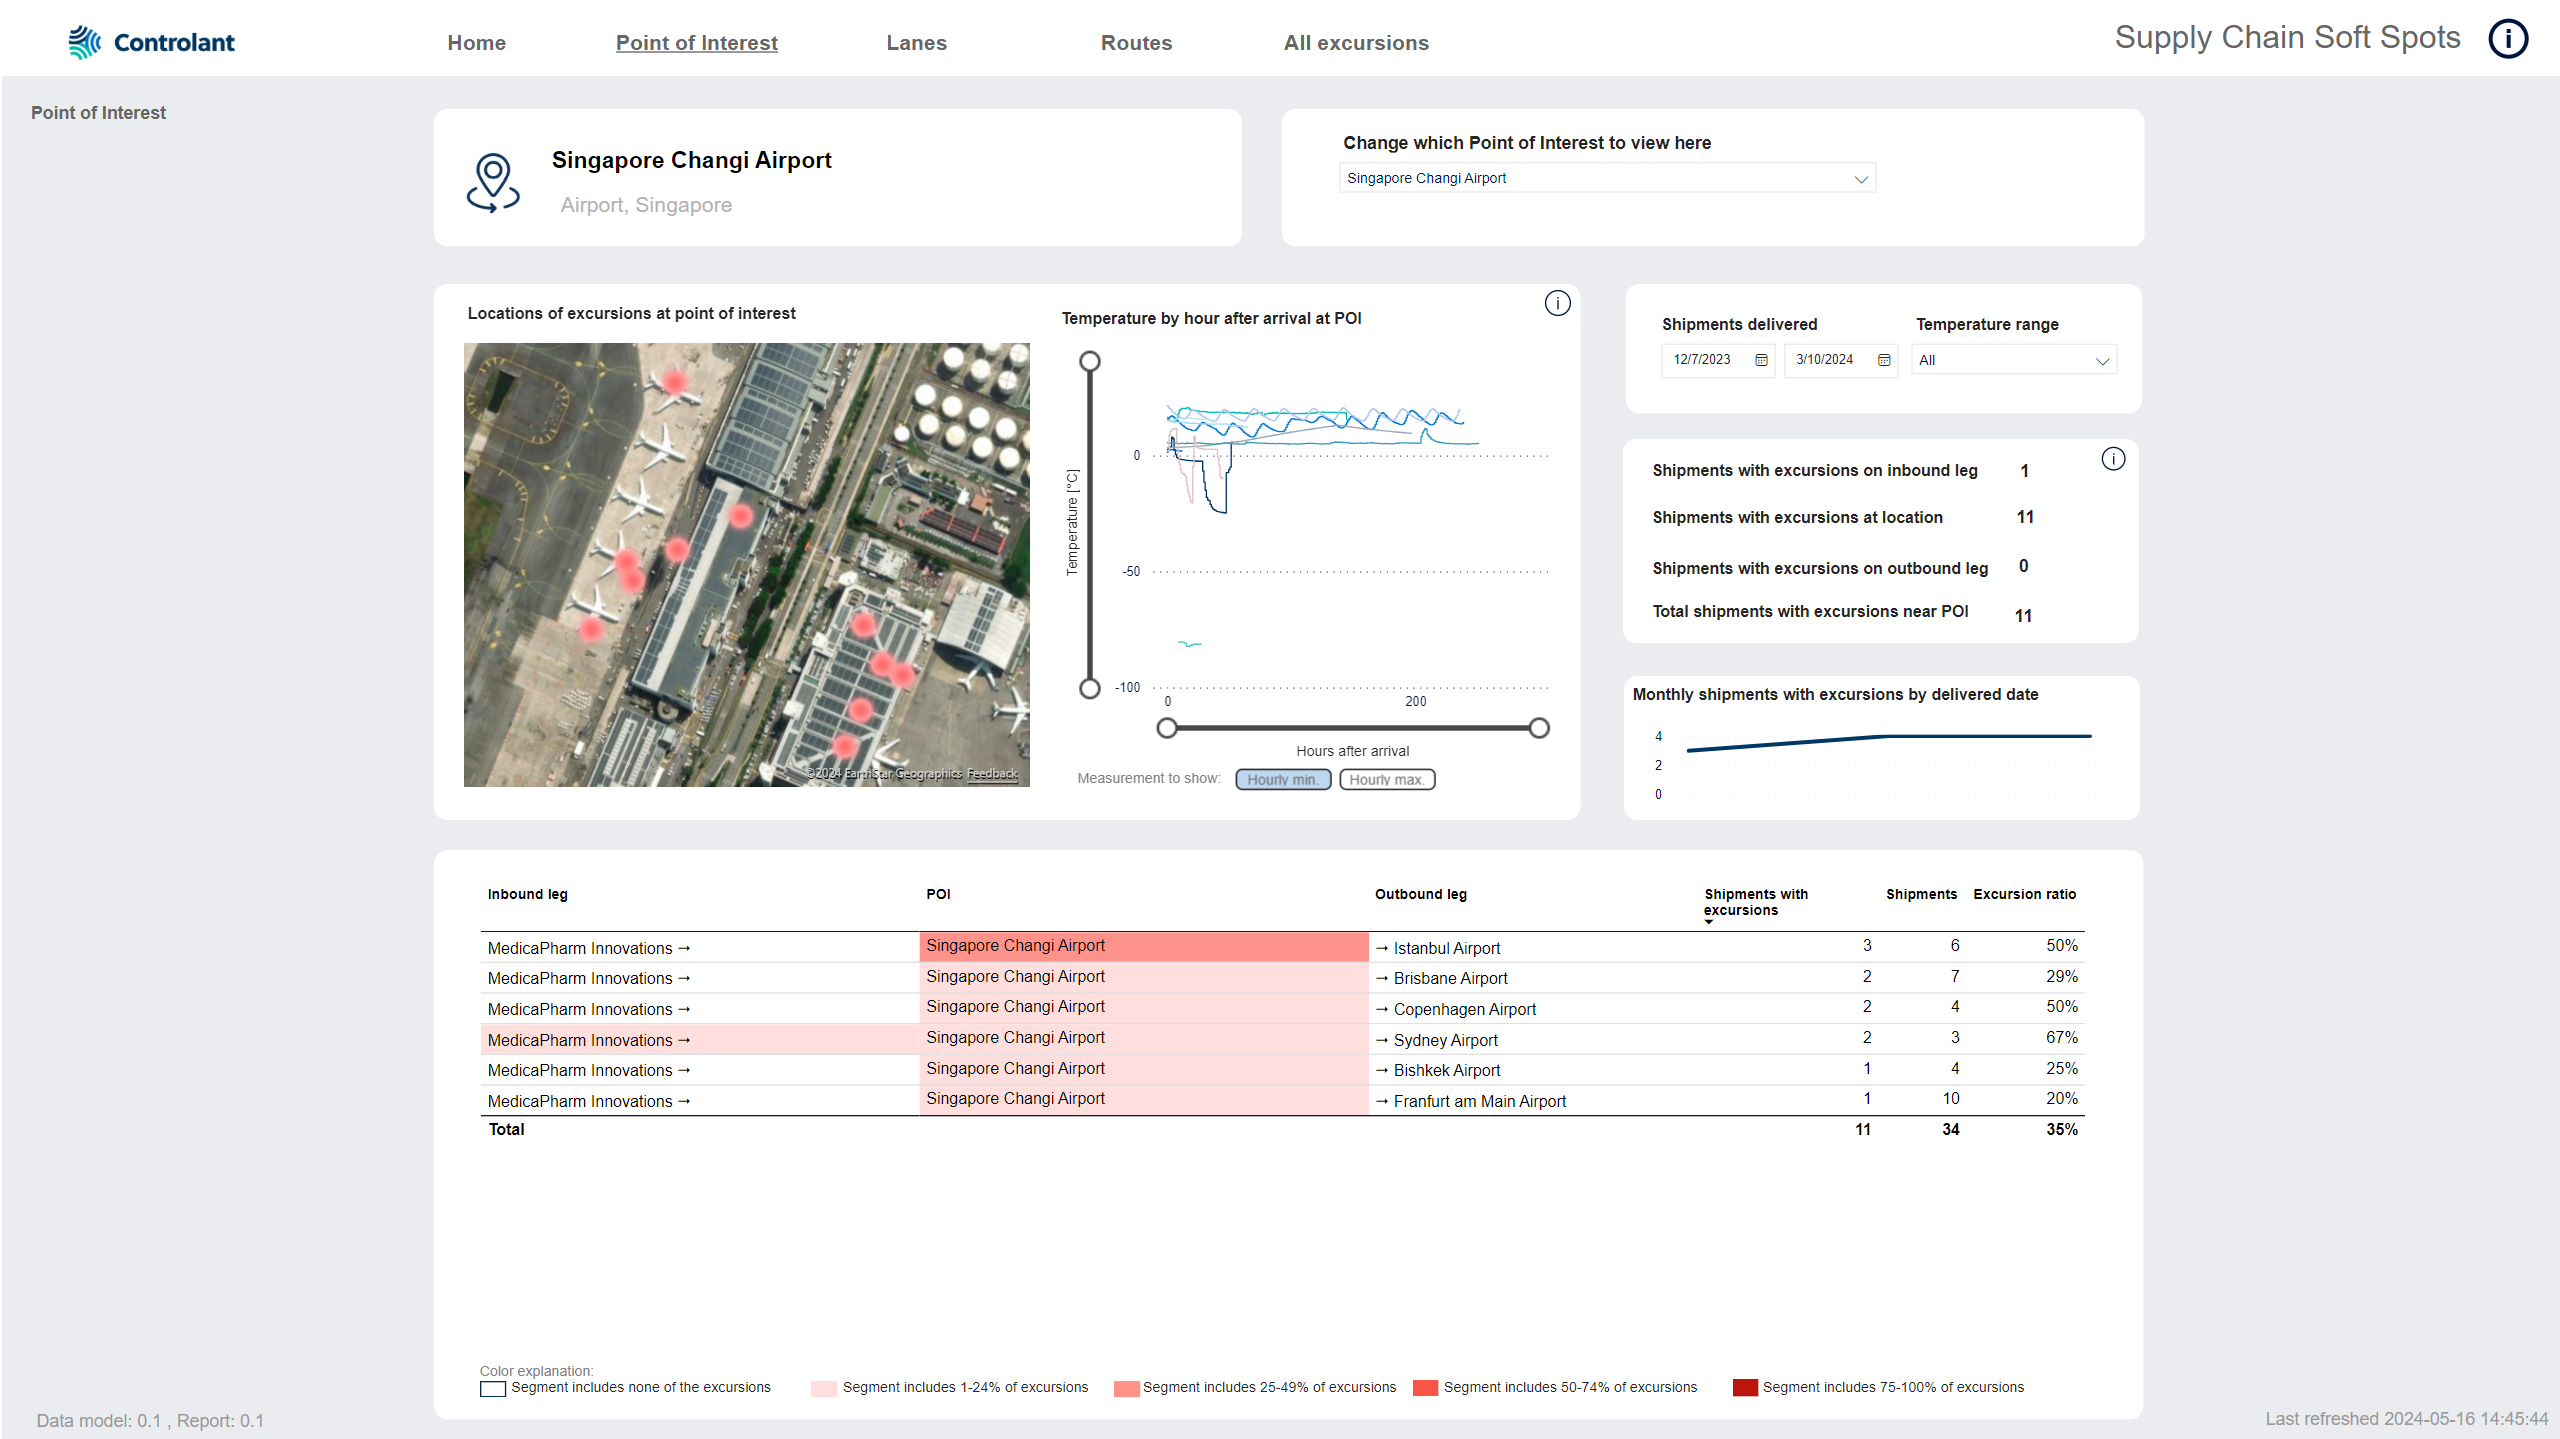
The Point of Interest tab shows in depth information about excursions at a specific point of interest (POI), including excursions that occurred on the inbound or outbound legs:
Heat map showing location of excursions at this POI.
Temperature trend of all selected shipments after arrival at this POI.
Details about excursions at this POI as well as on inbound or outbound legs.
Note
A point of interest (POI) is a a customer defined location, airport or harbor which shipments have traveled to and/or from.
Current POI

Point of interest: Name of POI, type of POI and location of POI.
Change which Point of Interest to view here

You can use the list to select another POI.
In the list, click another POI. The tab will update with data about the selected POI.
Tip
Start typing in the search box to filter the POIs in the list.
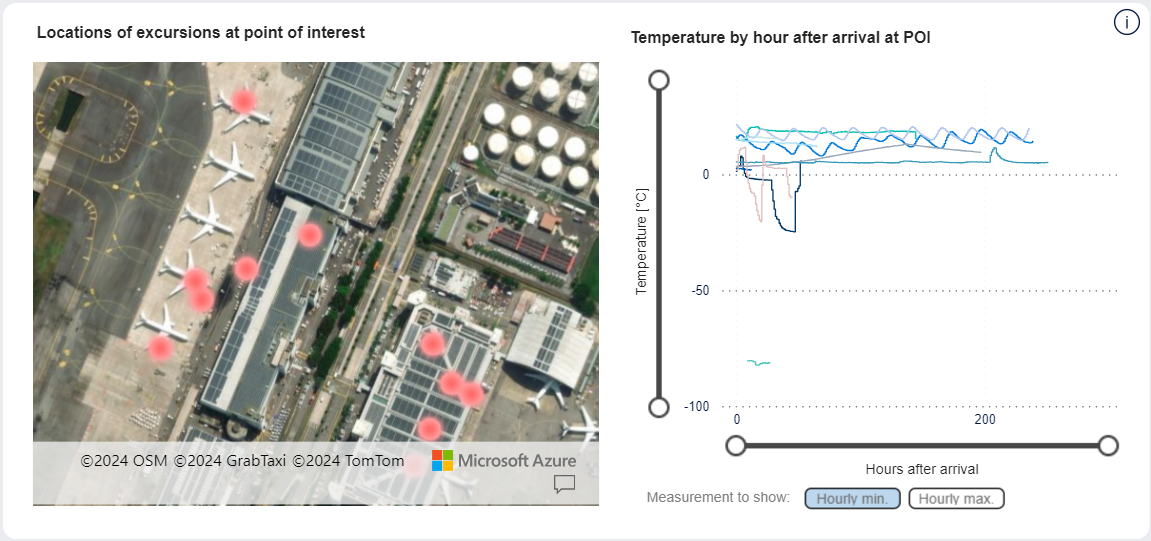
Details about this POI: Map showing location of excursions and graph showing temperature of shipments after arrival at the POI.
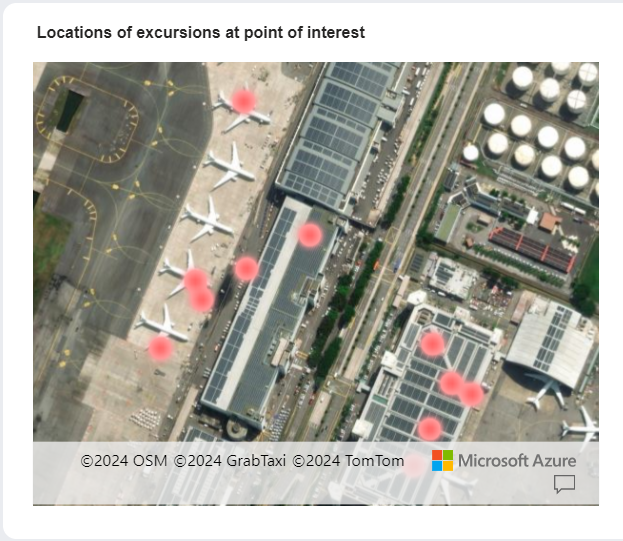
Interactive map showing exact location of excursions at this POI.
Tip
You can hover over a POI to see the following information:
geocoordinates of location
name of location
number of shipments with excursions at location
You can zoom in and out on the map:
To zoom in on the map, do one of the following:
Double-click the map.
Scroll up with the scroll button on your mouse.
To zoom out on the map, scroll down with the scroll button on your mouse.
You can resize the map:
To see a larger map, click
 (focus mode).
A larger map appears.
To return to the dashboard, click Back to report.
The previous page appears.
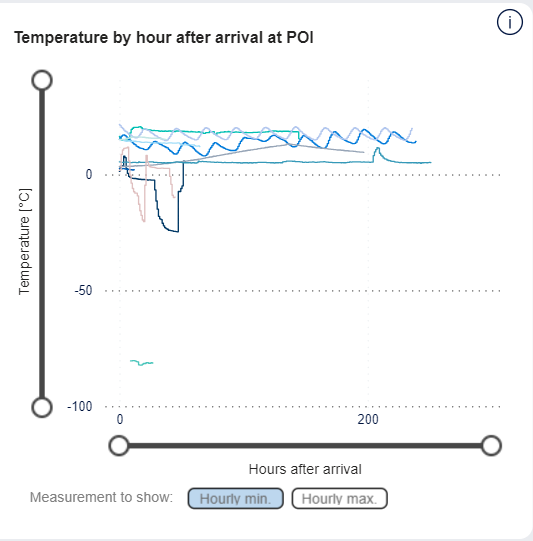
Graph showing temperature measurements of shipments after arrival at this POI.
Tip
You can toggle between showing the lowest or highest temperature measurements for each hour.
 - click to see lowest temperature reading for each hour
 - click to see highest temperature reading for each hour

You can filter the data in the page by the following parameters:
Item | Description |
|---|---|
Shipments delivered | |
Temperature range | Temperature range. Configured temperature range for selected shipments. Click one or more from the list. |
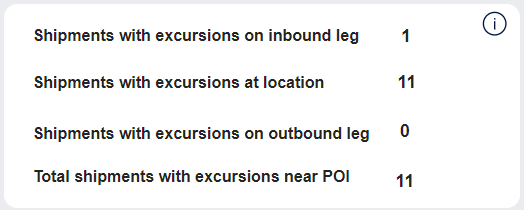
KPIs for this POI.
Item | Description |
|---|---|
Shipments with excursions on inbound leg | Number of shipments with excursions on the inbound leg - the leg of the shipment before arriving at this POI. |
Shipments with excursions at location | Number of shipments with excursions that occurred at this POI. |
Shipments with excursions on outbound leg | Number of shipments with excursions on the outbound leg - the leg of the shipment after leaving this POI. |
Total shipments with excursions near POI | Number of shipments with excursions that occurred at this POI or on inbound or outbound legs. |

Trend for number of shipments with excursions at this POI in the period selected in the filter above.
Tip
You can hover over images/graphs to see details in a pop-up.

List of segments going through this POI. A segment is part of a shipment that a contains a POI as well as one or both of an incoming leg and/ or an outgoing leg.
Tip
The background color of each location or leg indicates the ratio of excursions that occur on that POI/ leg. The darker the red color, the higher the ratio of excursions on the segment.
 - POI/ leg has no excursions.
 - POI/ leg has 1–24% of excursions.
 - POI/ leg has 25–49% of excursions.
 - POI/ leg has 50–74% of excursions.
 - POI/ leg has 75–100% of excursions.
Tip
You can click any column header to sort the contents of the table by the contents of that column. An arrow indicates the column the table is sorted by: An arrow pointing up indicates ascending order, and an arrow pointing down indicates descending order. Click the column header to toggle between the two.
Tip
Hover over a record in the table and a pop-up will appear with a breakdown of the excursions in this lane segment as well as the full location and leg names if those are not completely visible.
Item | Description |
|---|---|
Inbound leg | Inbound leg; leg shipment took to get to POI. Name of location from which the shipment came to the POI. NoteThe background color of each location or leg indicates the ratio of excursions that occur on that leg. |
POI | Name of POI. NoteThe background color of each location or leg indicates the ratio of excursions that occur on that leg. |
Outbound leg | Outbound leg; leg shipment took to leave POI. Name of location to which the shipment went from the POI. NoteThe background color of each location or leg indicates the ratio of excursions that occur on that leg. |
Shipments with excursions | Number of shipments with excursions on this segment. |
Shipments | Number of shipments on this segment. |
Excursion ratio | Ratio of shipments with excursions on this segment. |
