Supply chain soft spots dashboard
Release notes for Supply chain soft spots dashboard.
Solution | Data & Analytics - Supply chain soft spots dashboard |
Version | 1.0 |
Type of release | Major |
Live release date | xx September 2024 |
The Supply chain soft spots dashboard is wonderful!
New features
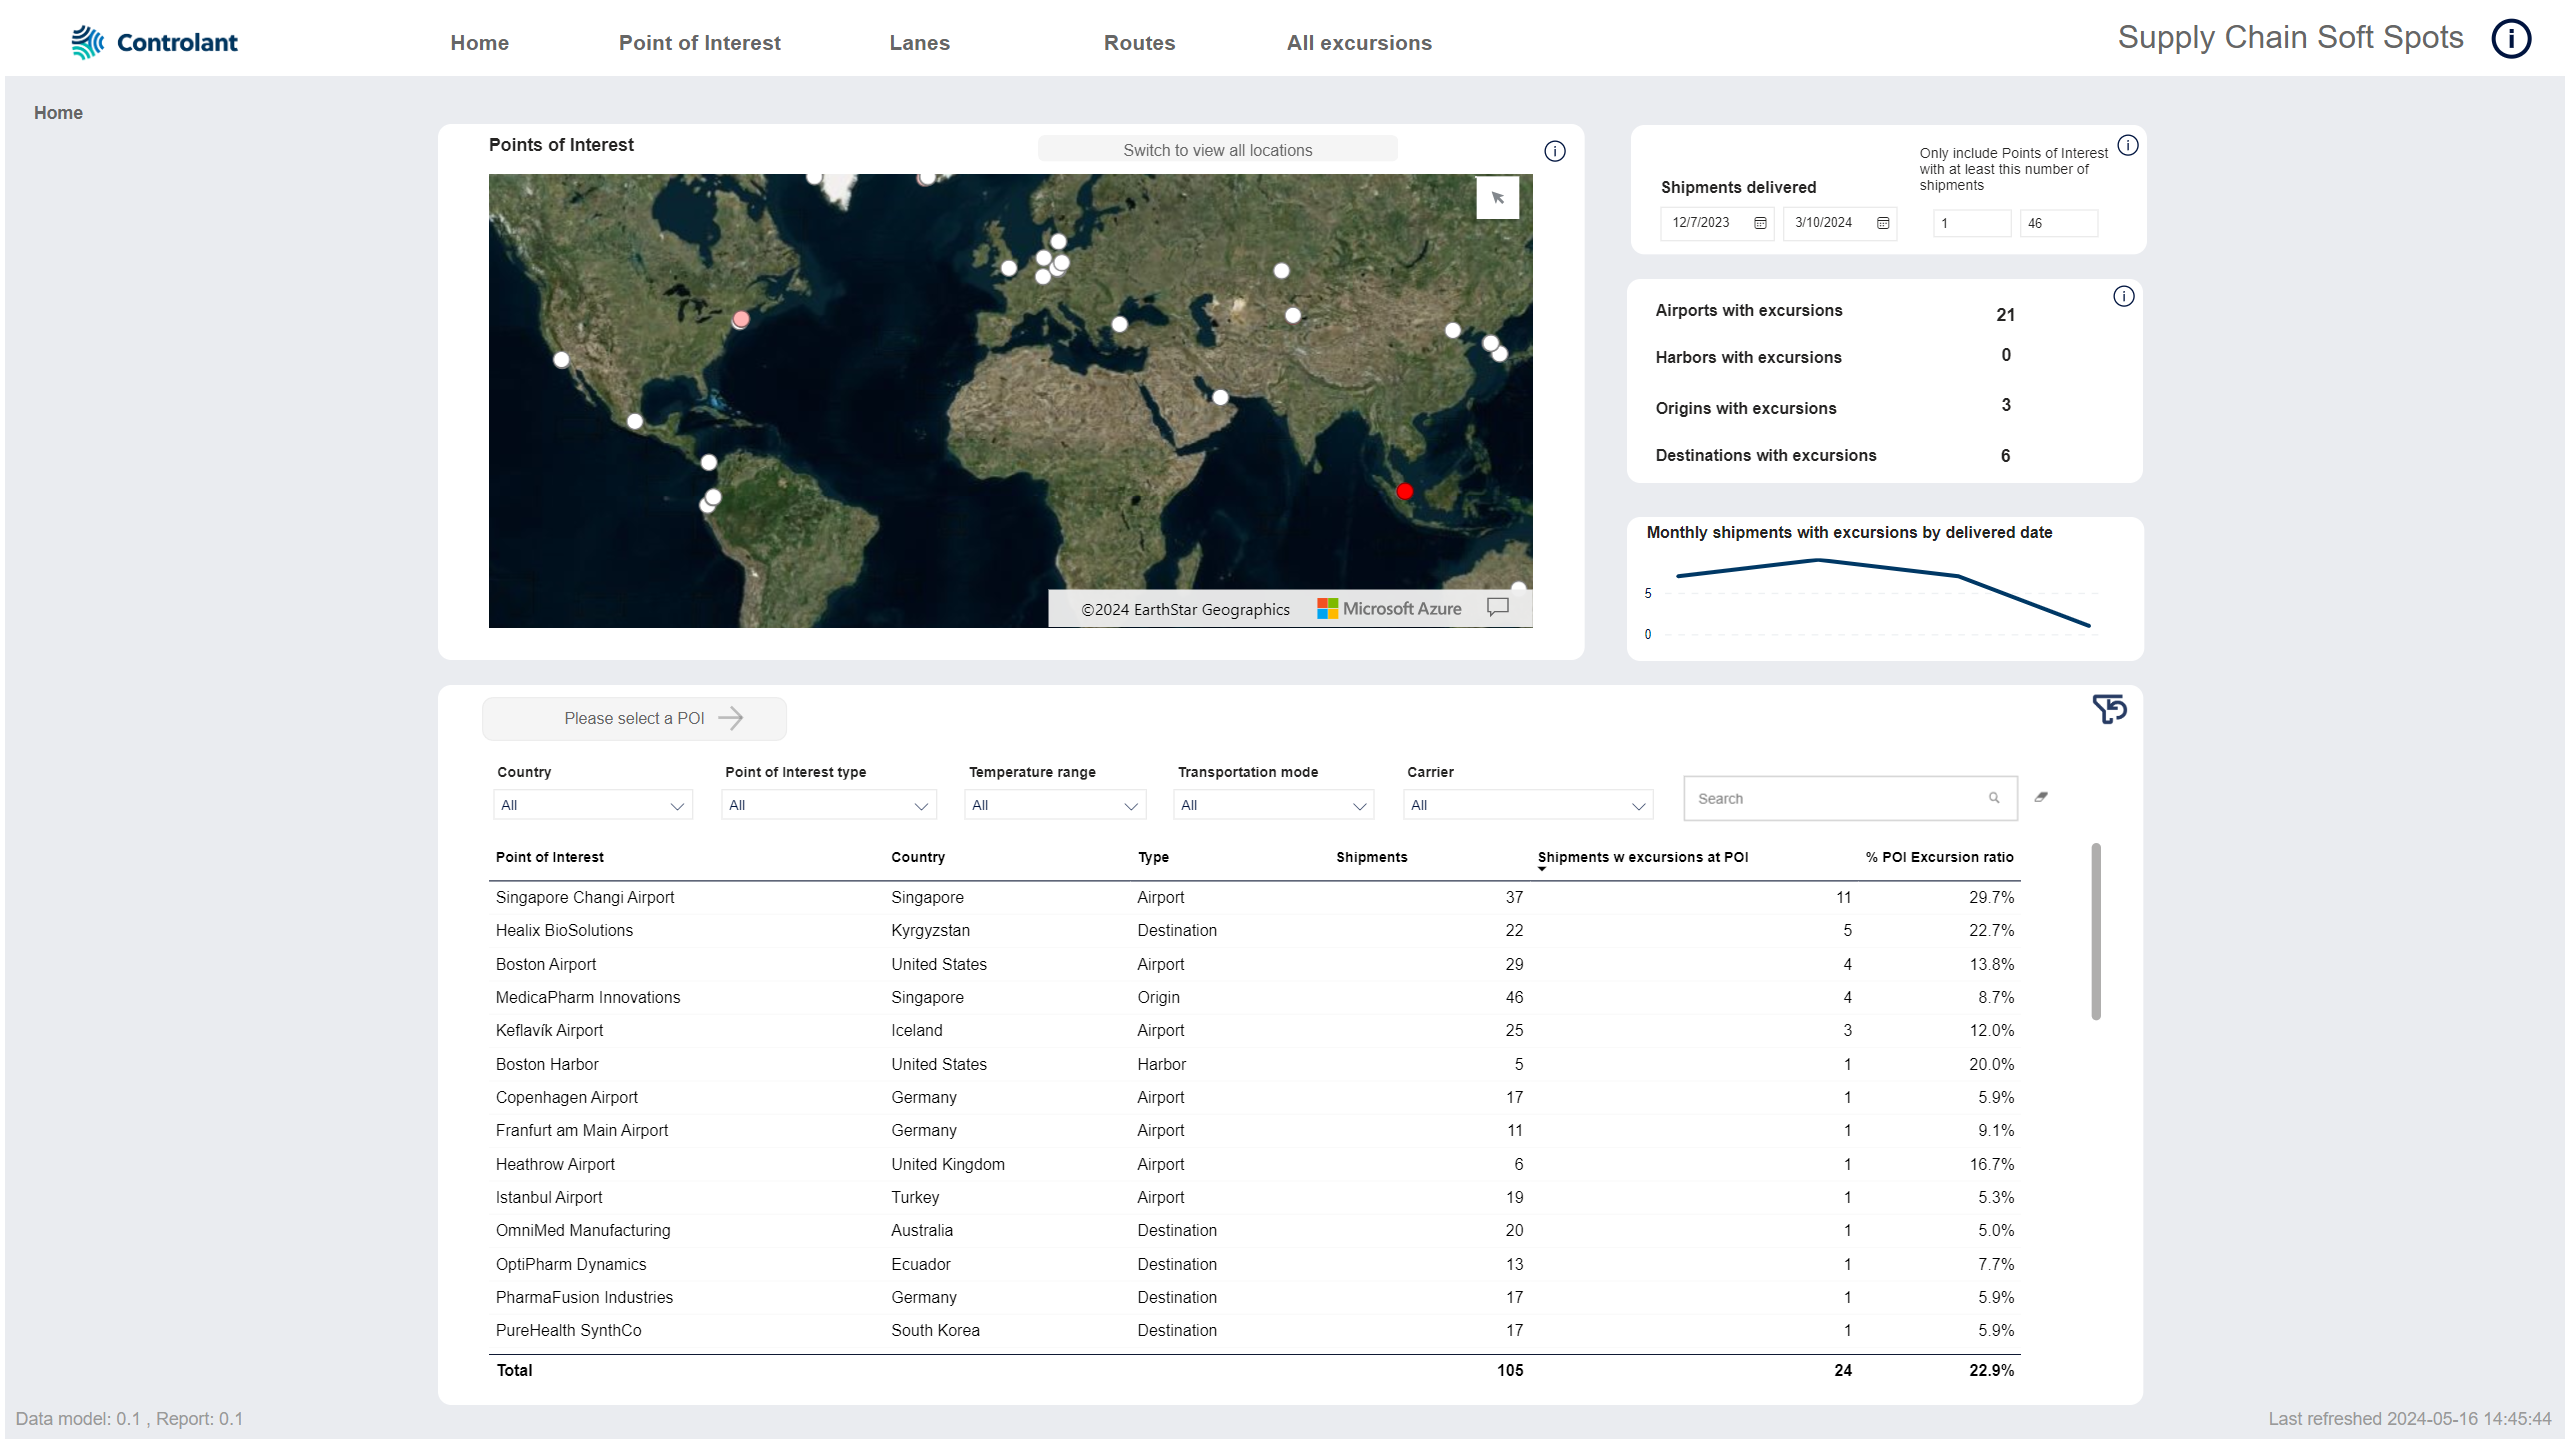
The Home tab shows overview of points of interest (POI):
Interactive map showing POIs.
Number of locations with excursions by type of location.
Monthly shipments with excursions by date delivered.
List of POI with details about the location, shipments and excursions.
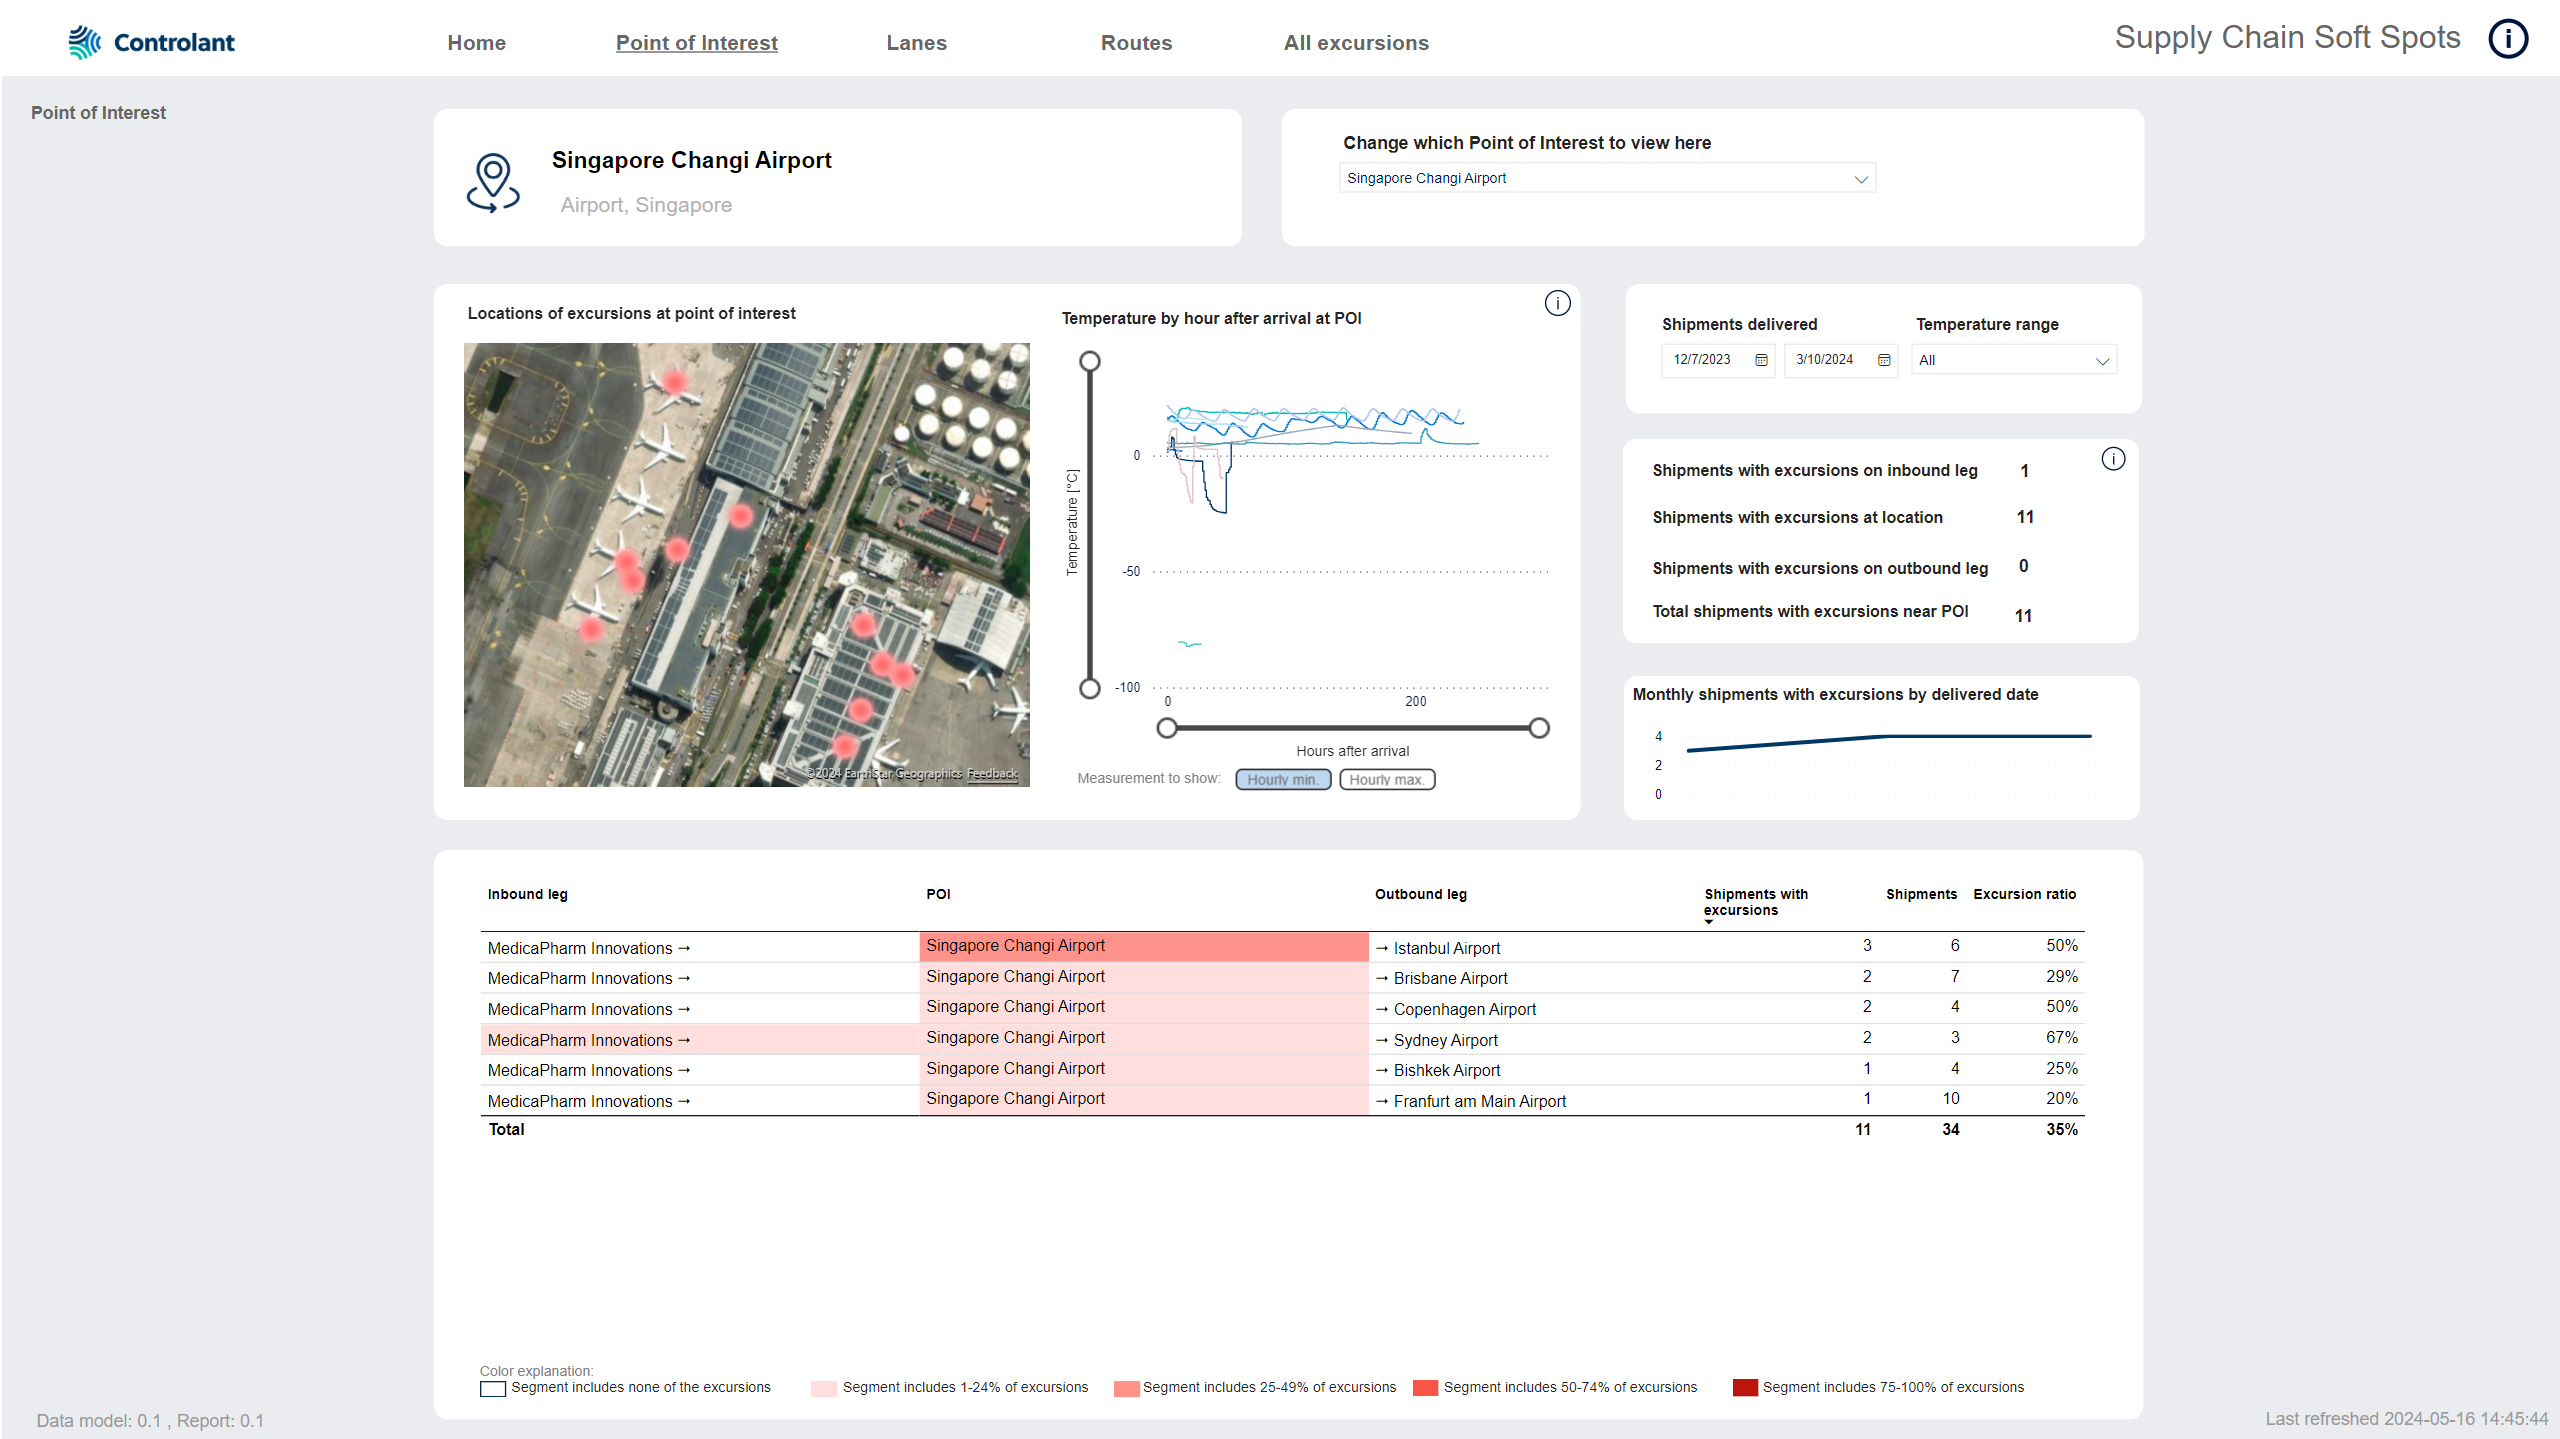
The Point of interest tab tab shows in depth information about excursions at a specific point of interest (POI), including excursions that occurred on the incoming or outgoing legs:
Heat map showing location of excursions at this POI.
Temperature trend of all selected shipments after arrival at this POI.
Details about excursions at this POI as well as on inbound or outbound legs.
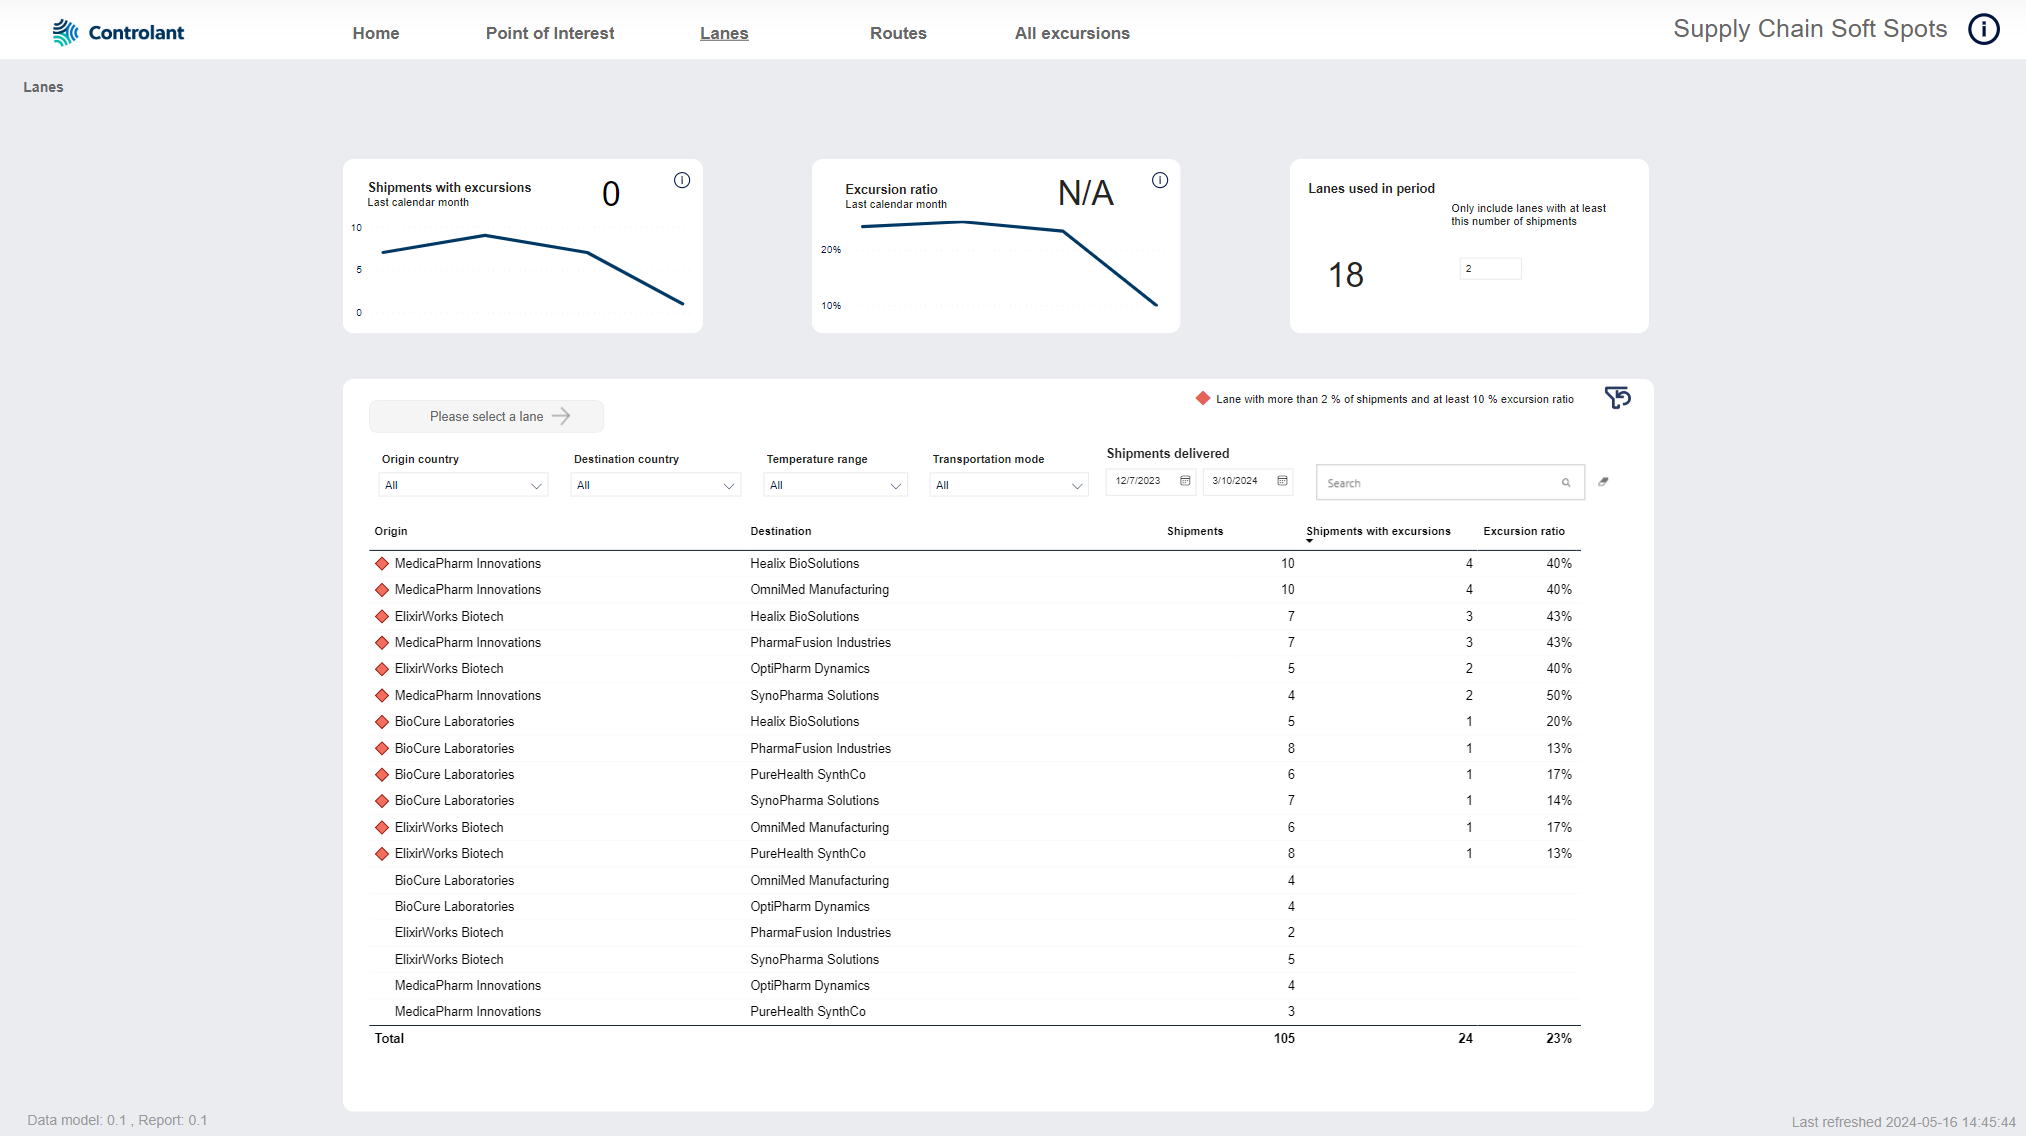
The Lanes tab shows information about excursions at specific lanes:
KPIs showing trend in excursions.
List of lanes.
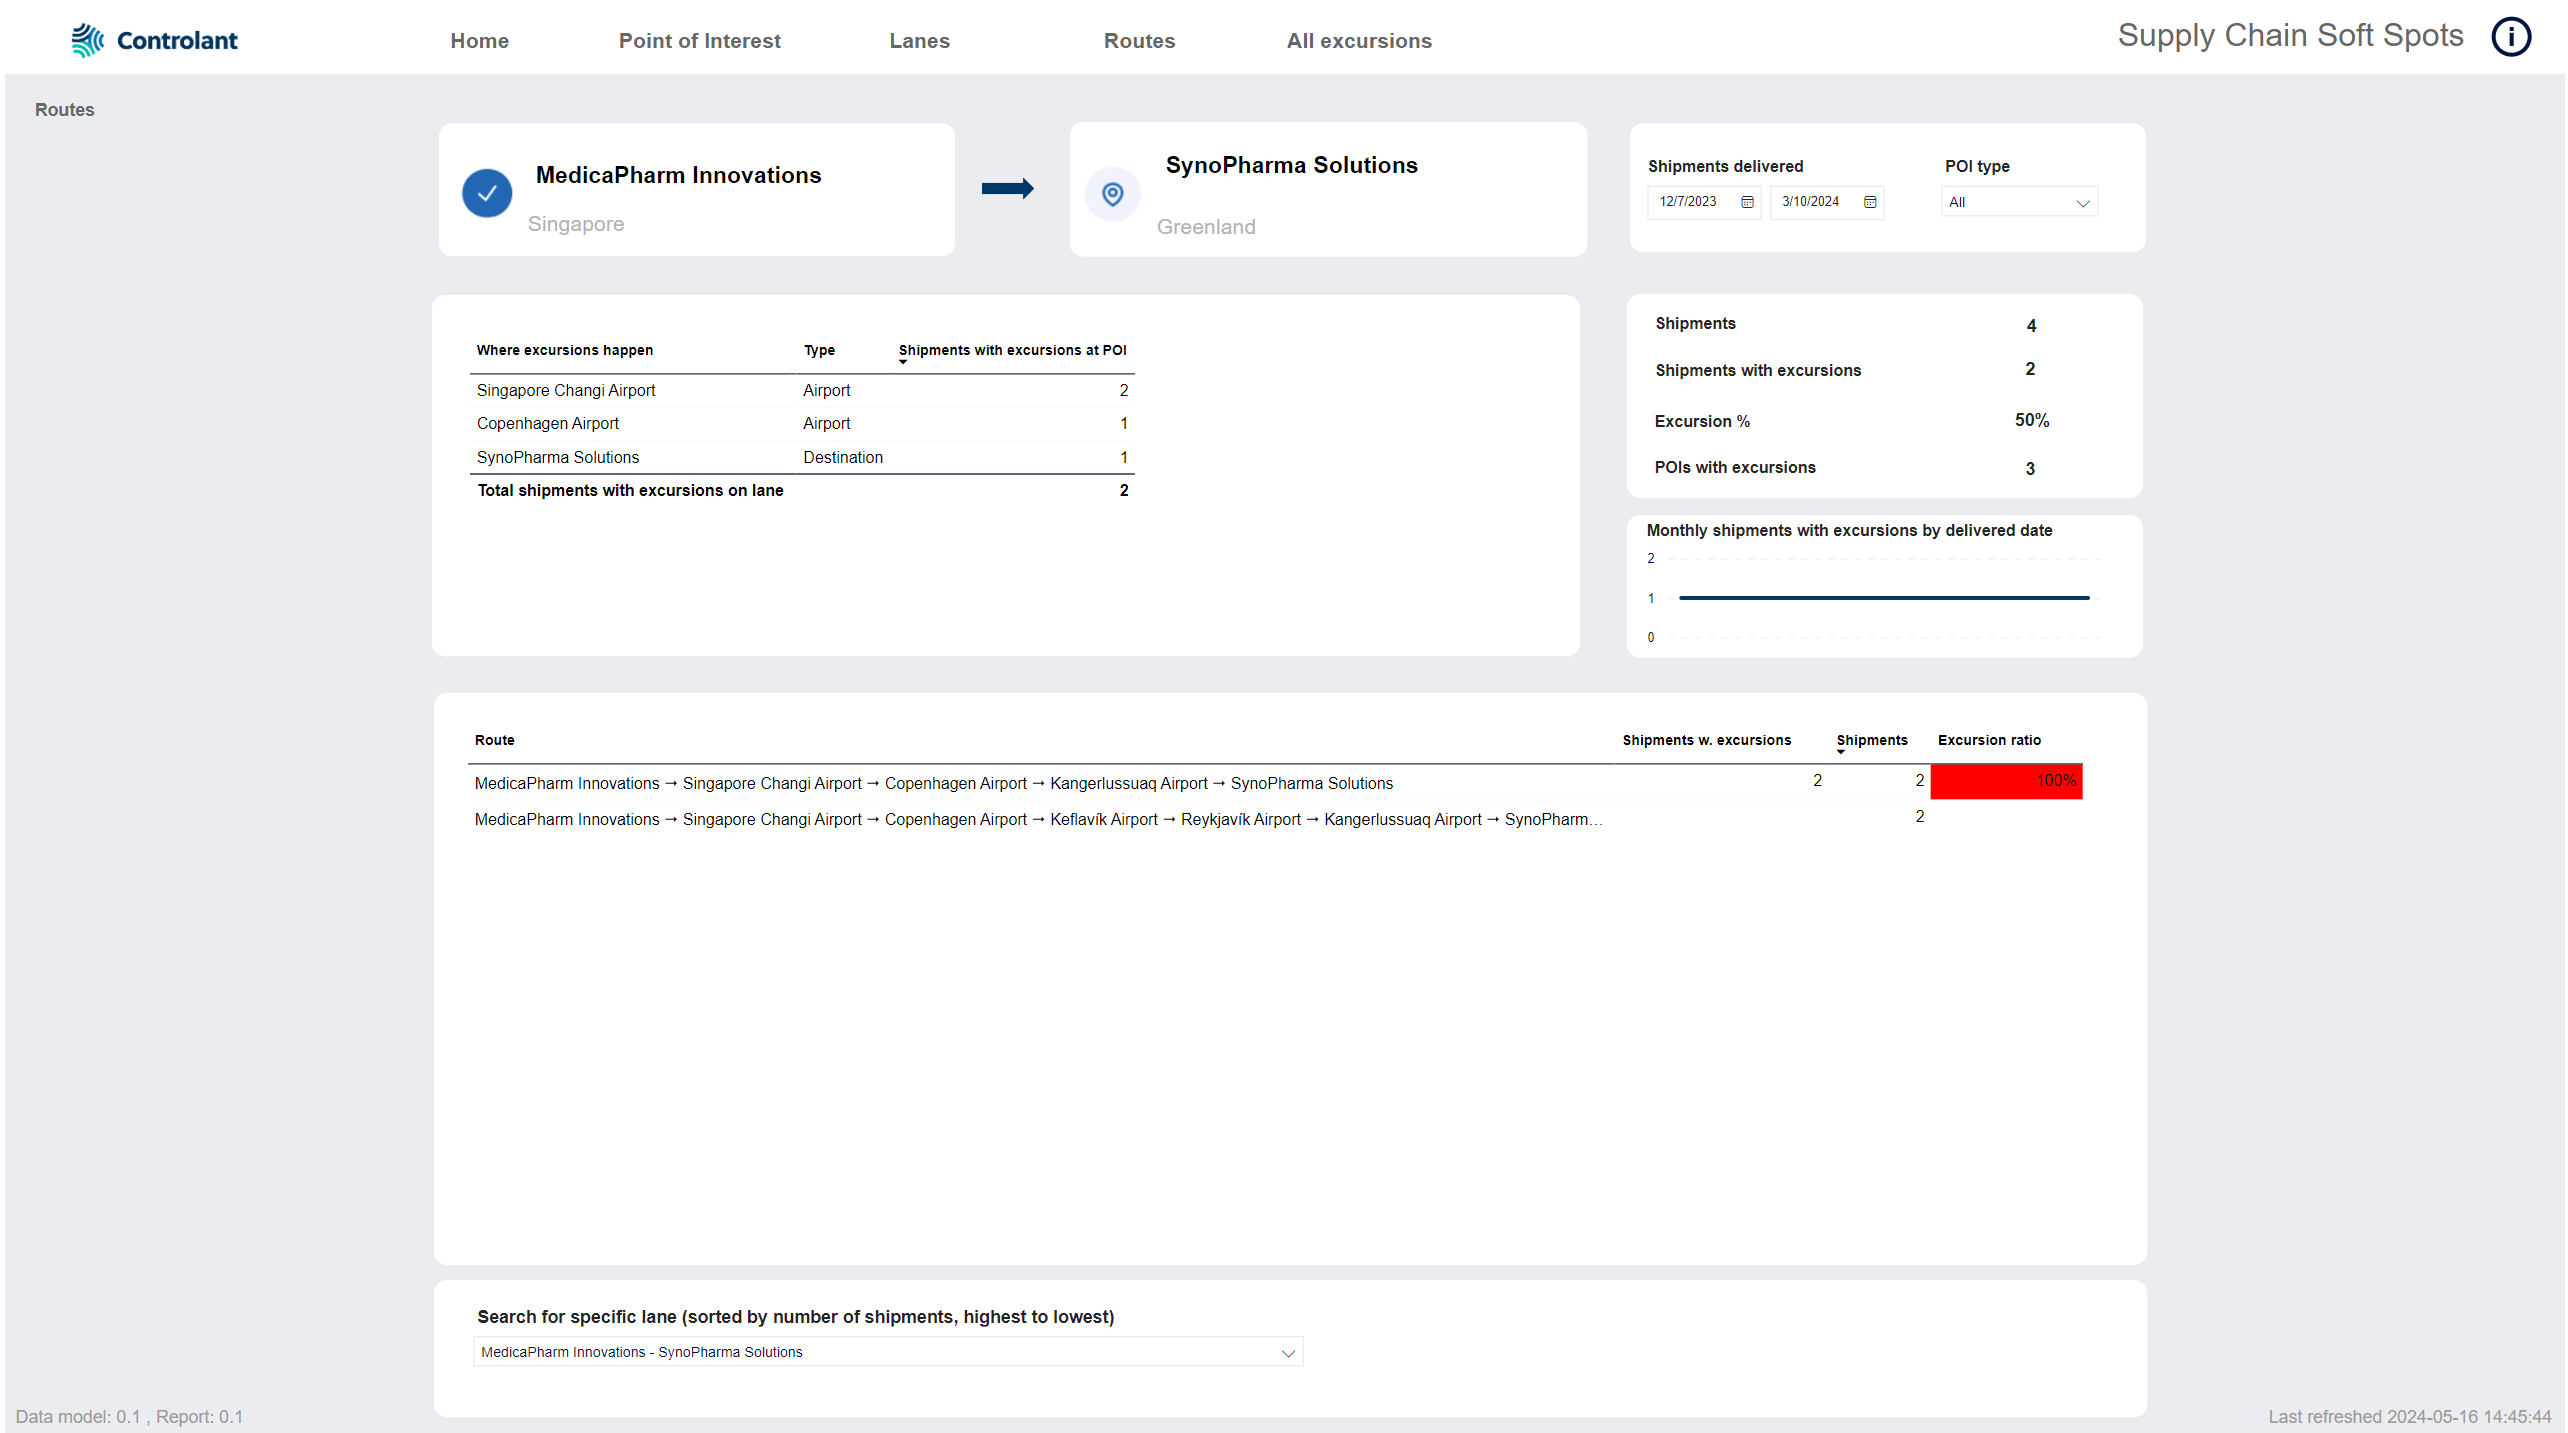
The Routes tab shows detailed information about the routes on a specific lane:
Different routes on the lane.
Locations of excursions on this lane and type of location.
List of routes with details on stops along the way.
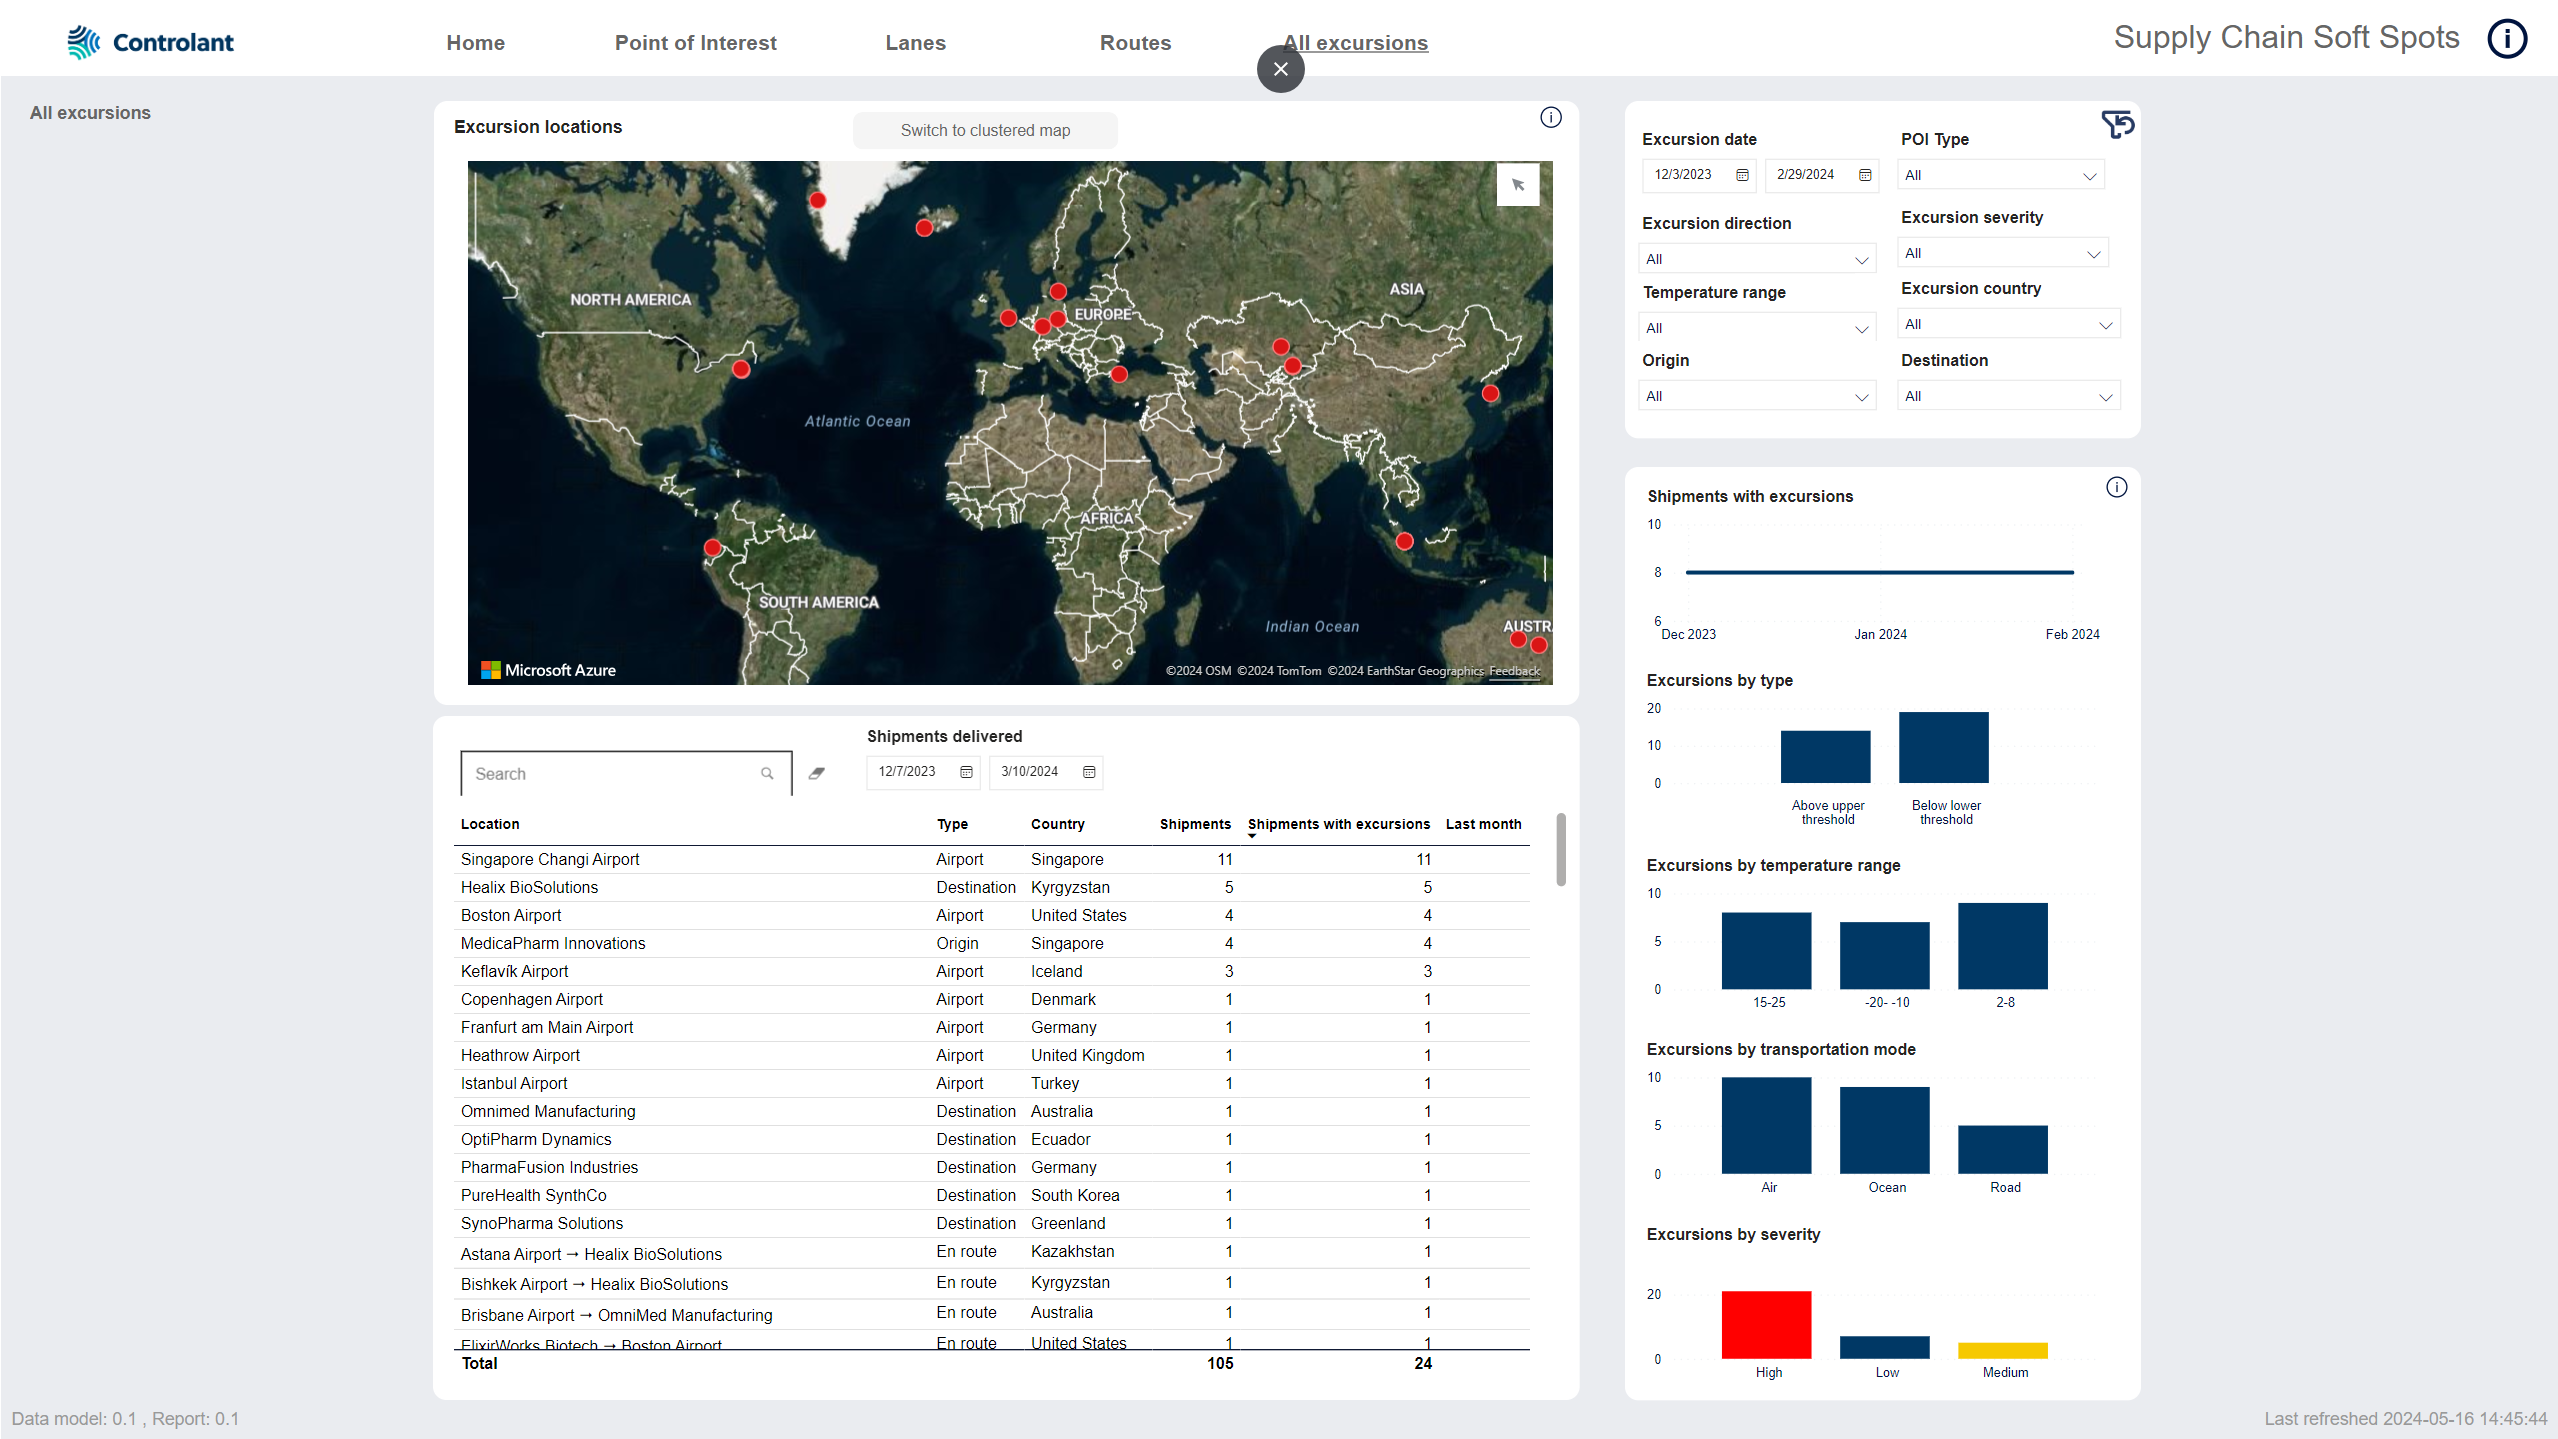
The All excursions tab shows information about all excursions:
Map showing location of excursions, clustered or non-clustered.
KPIs for excursions.
List of all locations/ legs that have excursions.
The Supply chain soft spots data model stores the underlying data for the Supply chain soft spots dashboard.
Thing
Other thing