Routes

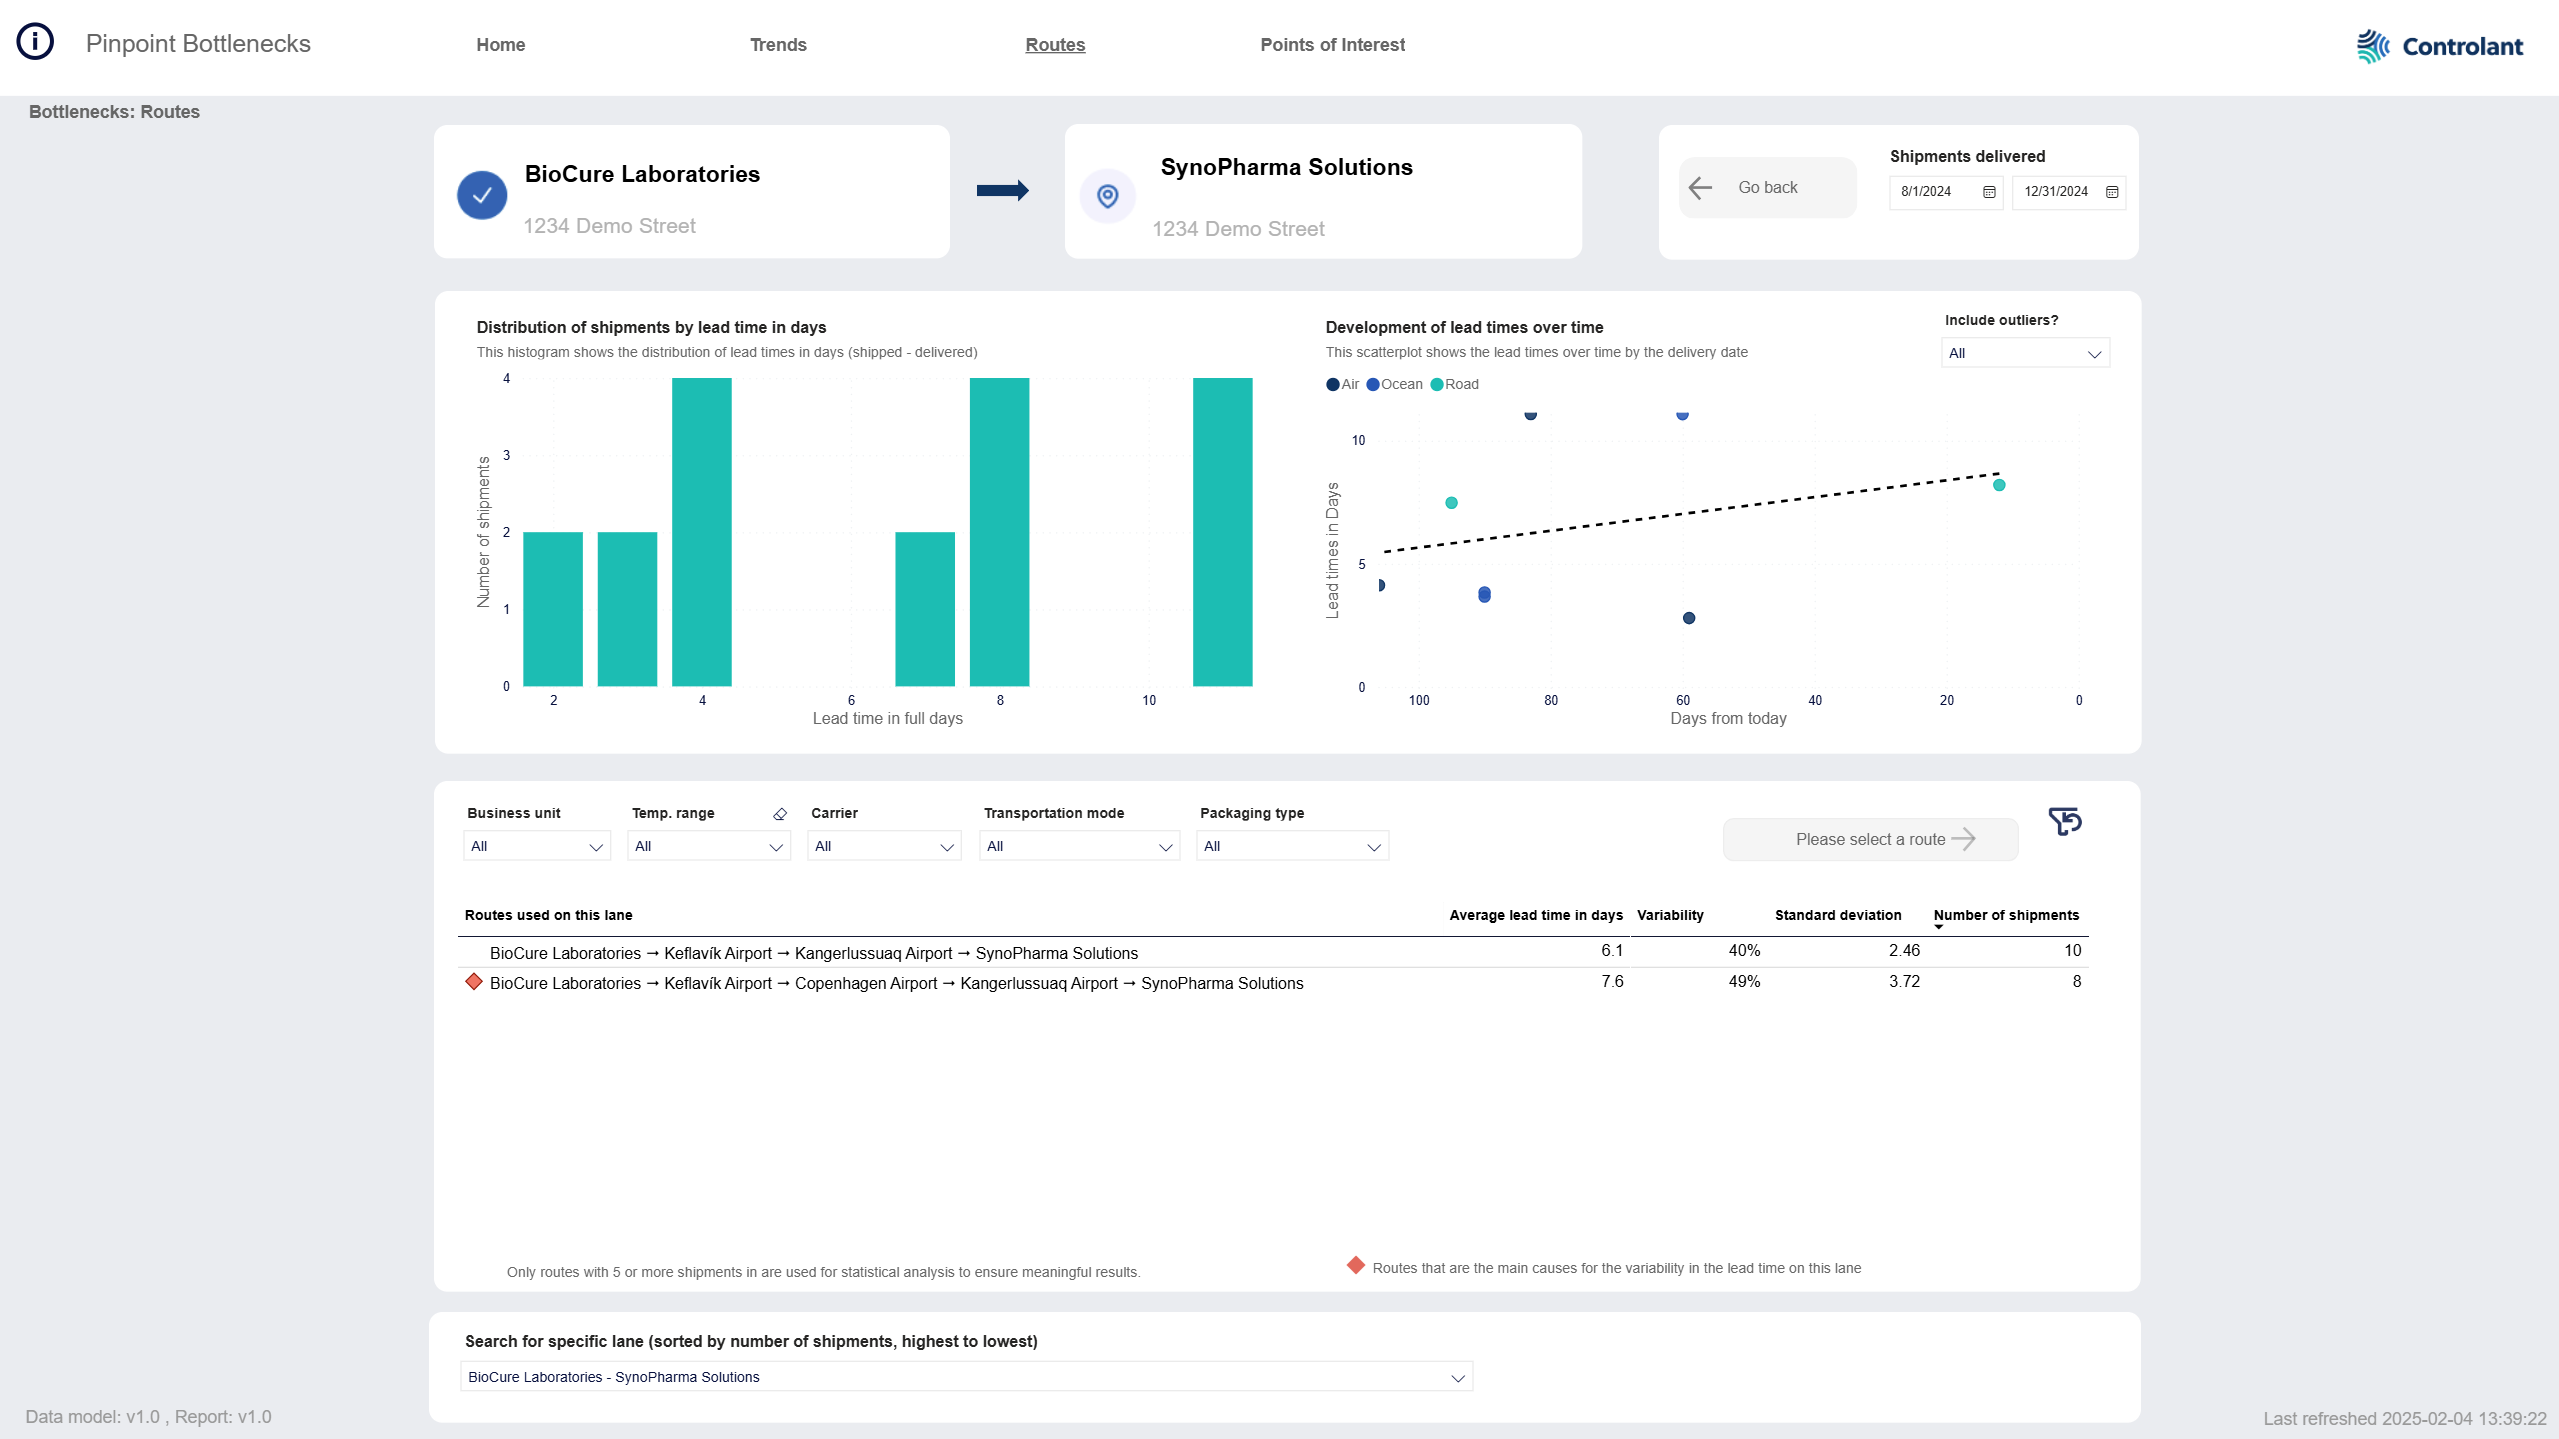
The Routes page shows details about the lead times on a selected lane.
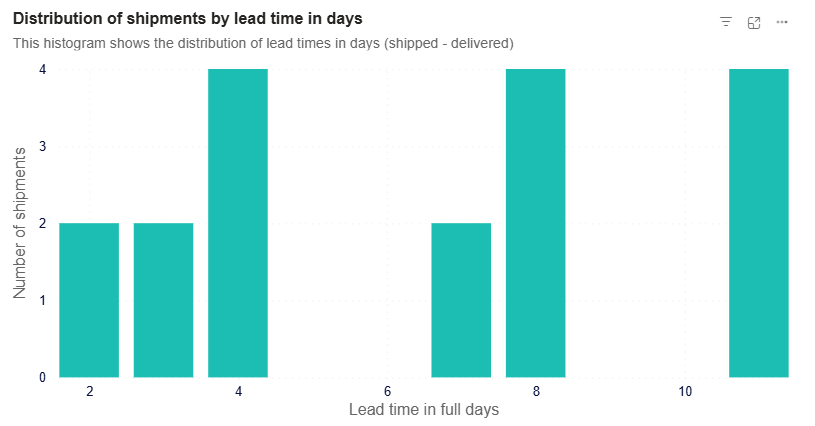
Graph showing distribution of shipments by lead time in days.
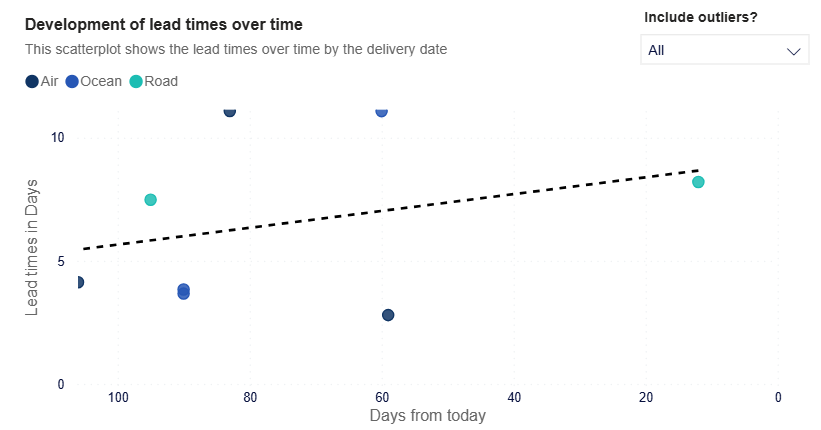
Graph showing development of lead times over time.
Details about the worst bottleneck routes for the selected lane.
To open the Routes page, in the Pinpoint Bottlenecks dashboard, do one of the following:
In the menu, click Routes.
In the Home page, in the Lane details table, select a lane and click Learn more.
In the Trends page, in the Lane trends details table, select a lane and click Learn more.
The Routes page appears.

Origin and destination locations of the selected lane.
All the data on the page is for routes on this lane.

Histogram illustrating the distribution of lead times (calculated as the difference between shipped and delivery dates), with each column representing the frequency of occurrences within a bin size of 1 day.
Tip
You can use the Include outliers filter to view data only for outliers or data excluding outliers:
All - shows data for all lanes.
Exclude outliers - shows data for lanes that are not outliers.
Only outliers - shows data for lanes that are outliers.
Your selection will affect all data on the page.
Item | Description |
|---|---|
y-axis Number of shipments | Number of shipments that had this lead time. |
x-axis Lead time in full days | Lead time, in number of days. Calculated as the number of days between shipped date and delivery date. |

Scatter plot showing individual data points, where each dot represents one shipment. The color of the dots indicates the transportation mode, and a trend line is included to quickly visualize the overall trend.
You can use a filter to either exclude outliers or focus solely on outliers, providing flexibility in analyzing the data.
Tip
You can use the Include outliers filter to view data only for outliers or data excluding outliers:
All - shows data for all lanes.
Exclude outliers - shows data for lanes that are not outliers.
Only outliers - shows data for lanes that are outliers.
Your selection will affect all data on the page.
Item | Description |
|---|---|
Lead time in days | Number of shipments that had this lead time. |
Days from today | Number of days before today. |

Details about routes on this lane.
To ensure meaningful results, this table only includes routes with 10 shipments or more.
More details

Select a route in the table below and click to view details about the selected route in the Route Analysis.

Select a route in the table below and click to view all shipments on the selected route in the Shipment details page.

You can filter the data in the table and on the Routes page.
The filters will affect the contents of the table as well as the map above.
Note
Not all customers have the same filters. You may not see all of the following filters, or you may have filters not shown here.
Tip
To clear the filter, click the eraser  .
.
Item | Description |
|---|---|
Business unit | Business unit of shipment, as configured in custom properties in Supply Chain Monitoring. |
Temp. range | Temperature boundaries configured for shipments. |
Carrier | Name of carrier or forwarder, as configured in custom properties in Supply Chain Monitoring. |
Transportation mode | Mode of transportation of shipment, as configured in custom properties in Supply Chain Monitoring. Click to select, or press CTRL and click to select more than one from the list. |
Packaging type | Type of packaging, as configured in custom properties in Supply Chain Monitoring. Click to select, or press CTRL and click to select more than one from the list. |
Route details table

List of routes on the selected lane.
To ensure meaningful results, this table only includes routes with 10 shipments or more.
Tip
To view more details about a route, do one of the following:

Select a route in the table below and click to open the ???.

Select a route in the table below and click to view all shipments on the selected route.
Tip
You can click any column header to sort the contents of the table by the contents of that column. An arrow indicates the column the table is sorted by: An arrow pointing up indicates ascending order, and an arrow pointing down indicates descending order. Click the column header to toggle between the two.
Item | Description |
|---|---|
Routes used on this lane | Routes on this lane: Locations along the way NoteA lane consists of a pair of origin and a destination locations of shipments. A route includes all the locations the shipment goes through on its way from origin to destination. A lane can contain multiple routes. |
Average lead time in days | Average lead time, in number of days. Calculated as the average number of days between shipped date and delivery date. NoteLead time is the time from when a shipment starts shipping until it is delivered in the Supply Chain Monitoring (SCM) system. |
Variability | Variability is expressed as the coefficient of variation, which compares the size of the spread (standard deviation) to the average lead time.
|
Standard deviation | Standard deviation of lead times, which measures how much individual lead times deviate from the average. A higher standard deviation indicates greater variability in lead times. |
Number of shipments | Number of shipments traveling through this route within the configured period. |
 | Indicates routes that are the main causes for the variability in the lead time on this lane. |

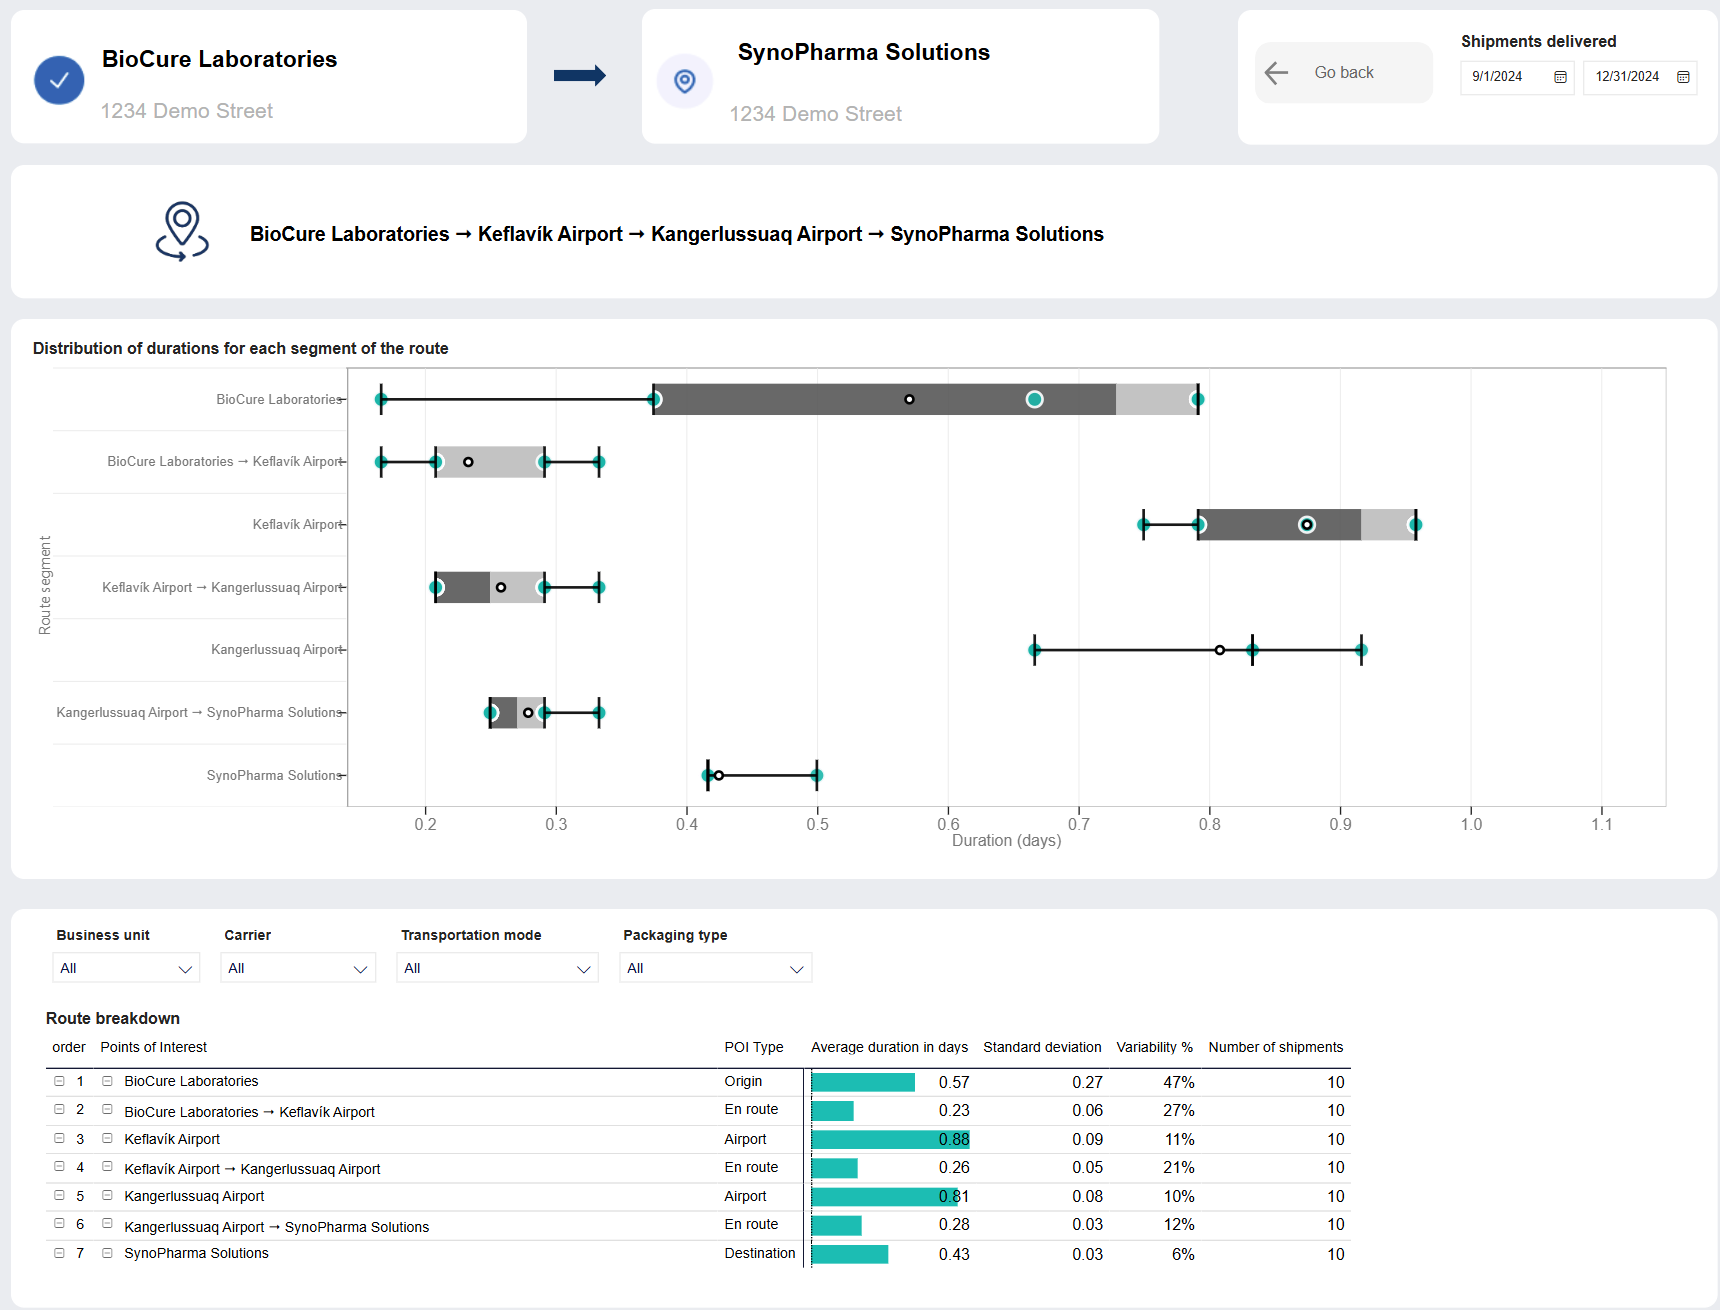
The Route analysis page shows detailed analysis of the selected route.
Note
This page is a drill through page and can only be accessed from Routes page.
To open the Route analysis page, in the Routes page, in the details table, select a route and click Learn more about route. The Route analysis page appears.
Lane

Lane this route is on.
To return to the Routes page, click Go back.

The Routes page appears.
Selected route
Route you are viewing the route analysis page for.


Box plot graph summarizing the duration of stays at locations (points of interest) and legs between locations for all shipments.

Table shows a list of all POIs/ locations on selected route with detail.

You can filter the data in the table.
The filters will affect the contents of the table as well as the map above.
Note
Not all customers have the same filters. You may not see all of the following filters, or you may have filters not shown here.
Tip
To clear the filter, click the eraser  .
.
Item | Description |
|---|---|
Business unit | Business unit of shipment, as configured in custom properties in Supply Chain Monitoring. |
Carrier | Name of carrier or forwarder, as configured in custom properties in Supply Chain Monitoring. |
Transportation mode | Mode of transportation of shipment, as configured in custom properties in Supply Chain Monitoring. Click to select, or press CTRL and click to select more than one from the list. |
Packaging type | Type of packaging, as configured in custom properties in Supply Chain Monitoring. Click to select, or press CTRL and click to select more than one from the list. |
Route breakdown details table

List of POIs/ locations on the selected route.
Tip
You can click any column header to sort the contents of the table by the contents of that column. An arrow indicates the column the table is sorted by: An arrow pointing up indicates ascending order, and an arrow pointing down indicates descending order. Click the column header to toggle between the two.
Item | Description |
|---|---|
Order | Order of POIs on this route. |
Point of interest | Name of point of interest (POI). NoteA point of interest (POI) is a a customer defined location, airport or harbor that shipments have traveled to and/or from. |
POI type | Type of point of interest (POI). |
Average duration in days | Average duration, in number of days, of one of the following:
|
Standard deviation | Standard deviation of duration, which measures how much individual lead times deviate from the average. A higher standard deviation indicates greater variability in lead times. |
Variability | Variability is expressed as the coefficient of variation, which compares the size of the spread (standard deviation) to the average lead time.
|
Number of shipments | Number of shipments traveling through this route within the configured period. |

The Shipment details page contains a list of all shipments on the selected route.
Note
This page is a drill through page and can only be accessed from the Routes page.
To open the Shipment details page, in the Routes page, in the details table, select a route and click See list of shipments. The Shipment details page appears.
To return to the Routes page, click Go back.

The Routes page appears.
Item | Description |
|---|---|
SCM link | Link to shipment in Supply Chain Monitoring (SCM) system. |
Shipment ID | Unique identifier of shipment. |
Ref Id | Customer created reference to shipment. |
Delivered date | Date shipment was delivered, in |
Shipped date | Date shipment was shipped, in |
Lead time | Lead time, in number of days. Calculated as the number of days between shipped date and delivery date. |
Origin | Origin location of shipment. |
Destination | Destination location of shipment. |
Transportation mode | Mode of transportation of shipment, as configured in custom properties in Supply Chain Monitoring. |
Carrier group | Name of carrier, as configured in custom properties in Supply Chain Monitoring. |
From country | Origin country of shipment. |
To country | Destination country of shipment. |
Temperature range | Temperature boundaries configured for shipment. |
Packaging type | Type of packaging, as configured in custom properties in Supply Chain Monitoring. |